Benefitra · SEO + Paid Search for Service Businesses

Be at the top of
Google twice.

The ad slot above the results, and the #1 ranking below it — both pointing to you. Paid search turns on this week. SEO compounds for months. Together you own the click, whether they trust the ads or scroll straight past them. One company per market.

Built by Juan Reyes (LinkedIn) — 17 years SEO/PPC, ex-Vensure. We will not sign your direct competitor. Prefer a call? Book a discovery call →

your service near me
Sponsored · paid search (live this week)
Ad your-company.comFree estimate this week · 4.9★ (212 reviews)
Organic results · SEO (climbing to #1)
SEO: full refund if we miss 5 of 7
5 of 7 ranking metrics in 90 days
PPC: pay nothing until you’re making money
Our fee starts only when your cost per acquisition beats benchmark
30% profit cap
Your upside is always ≥70%
One company per metro
Territorial exclusivity in writing

Two engines. One goal: more booked jobs.

Paid search turns on this week. SEO compounds for years. See what each one is worth to you — pick your industry to load typical numbers, then slide to match your own. Then run the free live audit to lock the SEO side to your real site, metro, and competitors.

Organic · SEO
What ranking #1 is worth to you

Set your numbers. We use the real click-through-rate curve by Google position to show the booked jobs you miss by not sitting at #1 — and what closing that gap is worth every month.

2,400
Pick your industry + city above to load real SEMrush volume for your metro.
120
Roughly what you pull from organic search today. The audit below measures it exactly.
#1
The rank you want to reach. We show the profit between your position today and this goal.
show clicks-to-conversion as
0.8%
Of every 100 visitors from Google, how many become paying clients. 0.5–2% is typical for service businesses.
$4,500
$10,000
Revenue (not profit) per job — sizes our 5% performance fee and your all-in cost.
One-time: each won client counts once. Switch to recurring if clients renew year after year.
Profit you're leaving on the table / mo
$--
The gap between your rank today and your #1 goal.
Cost per new client
$--
at our 30% cap
Your return
--
you keep ≥70%
Cumulative profit captured
1-year
$--
2-year
$--
3-year
$--
What this asset is worth when you sell
$--
Set your numbers to see the enterprise value your ranking adds.

Today (≈#26)

Clicks / mo--
Jobs / mo--
Profit / mo--

At #1 goal

Clicks / mo--
Jobs / mo--
Profit / mo--
How the math works. Clicks = monthly searches × the CTR for your position (real CTR-by-position curve, Advanced Web Ranking 2024). Jobs = clicks × your visitor-to-job rate. Profit = jobs × profit per job. The hero number is the monthly gap between your position today and your goal. The 1/2/3-year totals stack every month's new clients — and for recurring clients, the ones you won last year keep paying this year. SEO compounds; the full audit below locks it to your real site, metro, and competitors.
Paid · PPC
What a 20% lower cost per lead is worth

Set your paid numbers. We show what your program makes today, what it makes once we cut your cost per lead and cost per deal by 20%, and your net gain after our fee. Your ad spend is yours — never marked up.

$12,000
Paid straight to Google. We never mark it up.
$120
25%
$8,000
One-time deal value. If clients pay you every year, switch to recurring below.
One-time: revenue is a single deal. Switch to recurring if the figure above is what each client pays you per year.
35%
Your net gain after our fee / mo
$--
Extra profit from the 20% cost cut, after everything we charge.
Avg cost / customer
$--
all-in: ad spend + our fee
Cost / extra customer
$--
our fee per added deal
Your return
--
profit per $1 in fees
Cumulative net gain, after fees
1-year
$--
2-year
$--
3-year
$--

At today's cost

Leads / mo--
Customers / mo--
Profit / mo--

With our engine · −20%

Leads / mo--
Customers / mo--
Profit / mo--
Base management--
Performance — 5% of added revenue --
Total fee / mo (caps $7,500)--
Capped at 30% of the new profit we generate. Your upside is always at least 70% — refunded out of performance fees, never the retainer.
Book a 30-min paid-ads review →

These are quick estimates. Want your real, data-locked SEO number — a live Google Lighthouse audit of your site, your metro's actual search volume, your named competitors scored head-to-head, and a 24-month profit projection?

Run the full live audit →

What we promise.

One promise, in writing, measured on your own Google Search Console.

The ranking guarantee
We hit at least 5 of 7 ranking metrics in 90 days — or every retainer you’ve paid refunds, 100%.

No stair-step, no “we got close.” Plus the First Win milestone: at least one agreed money keyword on Google page 1 within 30 days, or your first month’s retainer refunds.

Read the term sheet
All 7 ranking metrics, in writing
METRIC 1

Organic traffic plus 30%

METRIC 2

Non-brand clicks plus 25%

METRIC 3

Net plus 10 keywords into top-20

METRIC 4

Plus 20 net-new top-20 indexed pages

METRIC 5

Plus 2.0 weighted average position

METRIC 6

Plus 8 ranks on money keywords (top 10)

METRIC 7

Schema completeness pass on all priority page types

Paid ads. Free until you’re winning.

One promise that swallows the rest: you don’t pay our management fee until your cost per acquisition is at least 20% below your benchmark. Until then, we run and optimize your campaigns for free. Your ad budget always goes straight to Google — never marked up, never through us.

The only guarantee that matters
You don’t pay us a cent in management fees until your cost per acquisition is 20% below your prior history — or your industry benchmark if you’ve never run paid search.

Until we clear that bar, we build, run, and optimize your campaigns and you pay us nothing to manage them — you only ever fund the ad budget, straight to Google. The day your cost per acquisition lands 20% below benchmark is the day paid search starts paying you back, and the day our fee begins. Measured on real closed-loop CRM data, with takeover-vs-new-campaign rules and closer-continuity safeguards spelled out in the term sheet — so neither side can game it.

Read the term sheet
See the 5 service & performance guarantees
SERVICE 1

First qualified lead within 30 days of your agreed ad page

SERVICE 2

Campaign live within 5 business days of an agreed page

SERVICE 3

Conversion and call tracking verified by end of week 1

PERFORMANCE 4

Cost per qualified lead 20%+ below your baseline — history or benchmark

PERFORMANCE 5

Cost per deal cut 20% with closed-loop CRM data

You own the ad account, data & pixel. Always.
Zero markup on ad spend — every dollar goes straight to Google.
No lock-in — month-to-month after the first 90 days.
On both engines — SEO and paid search
You always keep at least 70% of the profit.

We never charge more than 30% of the new profit we generate. At your 12-month anniversary we reconcile total fees against the new profit driven into your business; if it ever exceeds the cap, we refund the difference from performance fees — revenue share first, the retainer is the floor. Your ad spend is always your own money, paid straight to Google.

Read the term sheet

Real companies we helped. Real Google Search Console results.

Every card below is a real Benefitra client we drove these results for, measured by Google Search Console on the client's own domain. Three of them are before our newest automation engine, the historical baseline of our prior process. The fourth, peo4you.com, is the after, where the new system is now outperforming our own past best work in the hardest vertical we serve. Three client names are anonymized at their request and shown by tier and vertical only. peo4you.com is our in-house property and shown by name. If you are sitting at position 18 today in any of these tiers, the chart further down shows the timeline.

Real client · Tier 2 anchor · Before our newest engine

Moving and home services

Tier 2 vertical
Their total Google clicks30,989
Avg position trajectory27.4 to 9.3
Their page-1 share of clicks70%

We held this client at position 25 to 30 for 13 months while we built their technical and content foundation, then broke through to page 1 on 2026-02-01. Today, 70% of THIS client's clicks come from queries where the site ranks on page 1 of Google.

Google Search Console performance chart for the Tier 2 anchor (moving and home services). 31.4K clicks, 4.12M impressions, 0.8% CTR, average position 11.4. Position trajectory 27.4 to 9.3 across the window.
Click chart to enlarge · Source: Google Search Console export, 2024-12 to 2026-04
See the full Tier 2 case →
Real client · Tier 1 anchor · Before our newest engine

Entertainment and weddings

Tier 1 vertical
Their total Google clicks74,950
Their page-1 share of clicks67.6%

67.6% of THIS client's clicks now come from queries where their site ranks on page 1 of Google, on their own domain. Strong volume in a fragmented, less-authoritative category. Real Tier 1 anchor.

Google Search Console performance chart for the Tier 1 anchor (entertainment and weddings). 75K clicks, 13.4M impressions, 0.6% CTR, average position 14.6 across the window.
Click chart to enlarge · Source: Google Search Console export, 2024-12 to 2026-04
See the full Tier 1 case →
Real client · Tier 3 anchor · Before our newest engine

Law Firm

Tier 3 vertical
Their total Google clicks279,229
Their page-1 share of clicks59.8%

279K total clicks across the window. Strongest absolute-volume performer in the prior-engine portfolio. 60% of THIS client's clicks come from page-1 rankings in a high-authority, regulated, professional-services vertical.

Google Search Console performance chart for the Tier 3 anchor (legal, Canadian estate law). 279K clicks, 13.7M impressions, 2% CTR, average position 15.8 across the window.
Click chart to enlarge · Source: Google Search Console export, 2024-12 to 2026-04
See the full Tier 3 case →
Google Search Console performance chart for peo4you.com from February 2025 through February 2026, showing 13 months of clicks, impressions, and an average search position of 39.5 across the entire window. The pre-engine flatline.
Real client · Tier 4 anchor · Heavy YMYL · Before AND after our newest engine

peo4you.com

Insurance and employee benefits · the hardest vertical on the open web

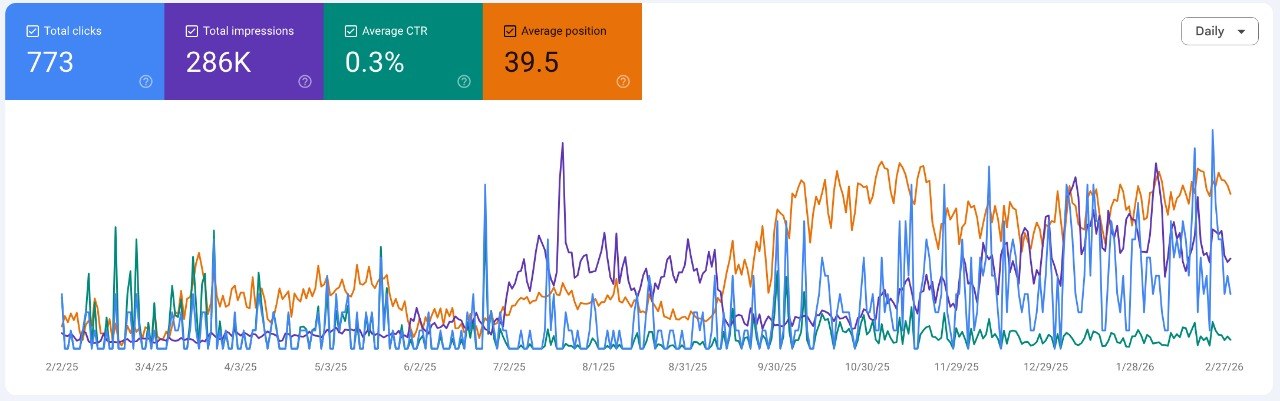
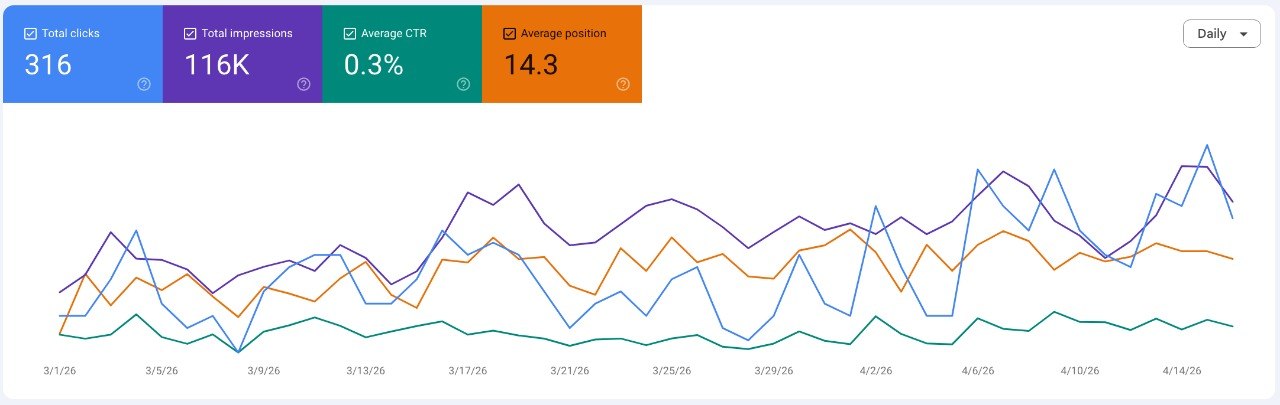
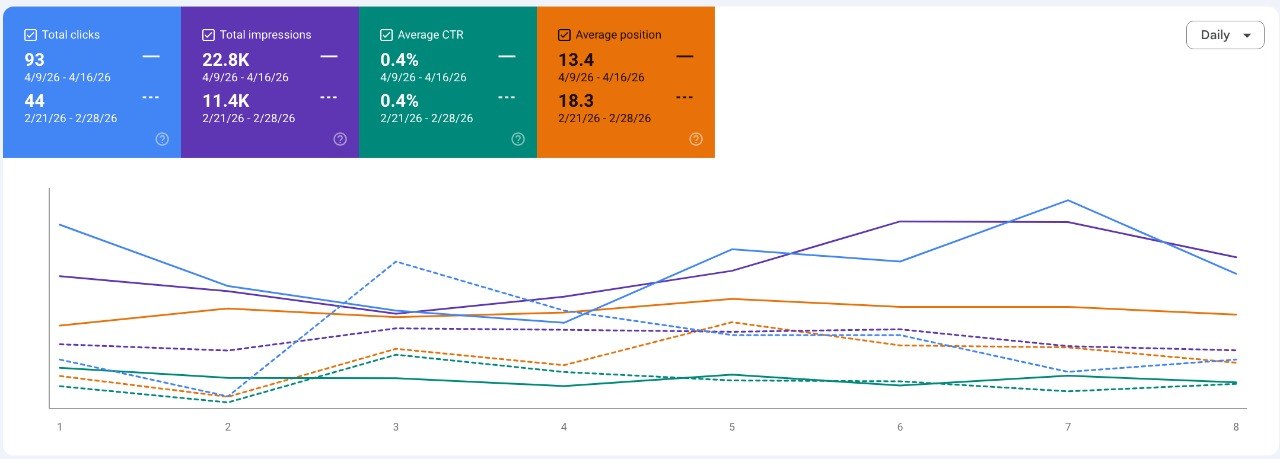
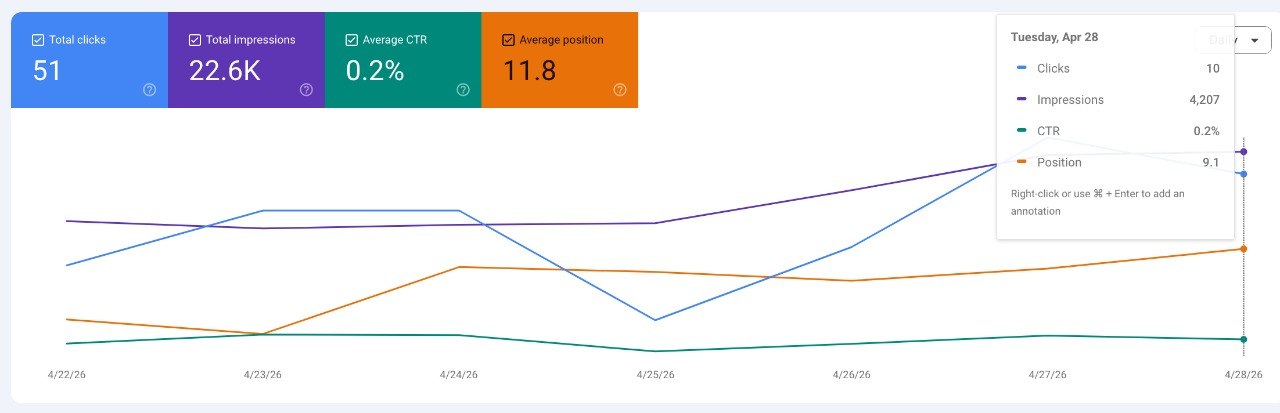
This is the proof case for why Tier 4 is so much harder, and why the new engine matters. From February 2025 through February 2026, thirteen straight months, peo4you.com averaged Google search position 39.5. Bottom of page 4. Stuck. In the most regulated, most over-credentialed, most algorithmically-suspicious vertical on the open web. 286K impressions and 773 clicks across the entire window, averaging single-digit clicks per day. That is what employee-benefits SEO looks like without the new system. Then in March 2026 we deployed our new automation engine. The Mar 1 - Apr 14 window: average position climbed to 14.3, with 116K impressions and 316 clicks. The last 16 days (Apr 12 - Apr 28): average position 12.6, 47.1K impressions, 133 clicks. The most recent 7 days (Apr 22 - Apr 28) tightened further: average position 11.8, 22.6K impressions, 51 clicks. And on Apr 28 the property cracked the top 10 for the first time ever, at average position 9.1. Direct A/B in 8-day blocks: Apr 9-16 (avg pos 13.4, 93 clicks, 22.8K impressions) versus Feb 21-28 (avg pos 18.3, 44 clicks, 11.4K impressions). 2x the clicks, 2x the impressions, 5 positions improvement, in roughly six weeks. 9 days after a 3-site duplicate-content penalty hit, the system rebounded the client back to page-2-bordering-page-1 territory. Same engine we are now selling. Same vertical. Same Google.

13-month pre-engine avg pos39.5
Last 7 days avg pos11.8
First top-10 day (Apr 28)9.1
Penalty rebound9 days

The pre-engine GSC window (Jan 2025 – Feb 2026, US) is sharper than a single-number summary suggests. The first eight straight months — Feb through Sept 2025 — were a genuine flatline at avg position #59, single-digit clicks per day, the property stuck in the bottom of the SERP. Oct–Nov 2025 (avg #23) was the prior engine compounding before its successor shipped. Impression-weighted across the full 14-month window: avg position 39.5. That's what the BEFORE column in the tier table below measures, roughly the Top 30% slice of this vertical. The hockey-stick March–April 2026 breakout is the visible inflection point of the new engine, distinct from the prior-engine drift — the moment the curve bends decisively. The 9-day post-penalty rebound is proof of system robustness. The PROJECTED column extrapolates that breakout velocity forward, conservatively, to where Tier 4 lands once the engine compounds. Every band below is anchored on real client data.

Source: Google Search Console exports across our portfolio properties. Window: 2024-12 through 2026-04. Total observed: roughly 16 months. Full methodology and raw exports available on the proof page.

In their own words.

The track record above is the measured part. This is the operator-to-operator part.

Engagement experience
“They underpromised and overdelivered — higher quality work, ahead of schedule, and with less effort from us than we expected. All my prior providers would overpromise and underdeliver.”
Art Slate Roofing logo
Arturo Nieto
Owner, Art Slate Roofing · Greater Boston
Slate & copper roofing specialist
Delivered
Higher quality
Ahead of schedule
Less effort
Than promised.
Than committed.
From the client side.
Real client, named with permission.
Operator-to-operator engagements. Book a discovery call to see if we’re a fit for your shop.

Position 18 to position 10. By industry.

If you are sitting at position 18 today, this chart is the timeline our process produces in each difficulty tier. The curves are derived from the measured trajectory of our portfolio anchors, not a third-party estimate.

Projected position climb under our NEW engine: pos 18 → pos 10

Months on the X-axis. Position on the Y-axis (lower is better). All four curves are projections under our new automation engine, calibrated against peo4you.com's measured Mar-Apr 2026 breakout. The pre-engine baseline (what your trajectory looks like without us) is captured in the "Before our innovative system" column of the table below.

Tier 1 Light · 1–4 mo
Tier 2 Moderate · 1–6 mo
Tier 3 Heavy · 2–8 mo
Tier 4 Heavy YMYL · 2–12 mo · peo4you.com
3 asymptote · pos 3 5 10 page 1 floor 15 18 starting line 20 25 30 0 1 2 3 4 5 6 7 8 9 10 11 12 Months from kickoff Google search position start

Methodology · updated May 2026. Curves derived from our measured trajectory across five real client properties: a Tier 1 entertainment and weddings anchor + a Tier 1 mobile-marketing anchor, a Tier 2 moving and home services anchor, a Tier 3 law-firm anchor, and peo4you.com (Tier 4, regulated employee benefits). The Tier 4 anchor (peo4you.com) is the only true cold-start: 13-month pre-engine flatline (Feb 2025 - Feb 2026) at average position 39.5. The new automation engine deployed in March 2026 and the visible Mar-Apr 2026 inflection (Mar 1 - Apr 14: avg pos 14.3 across 116K impressions; last 16 days Apr 12 - 28: avg pos 12.6 across 47.1K impressions; last 7 days Apr 22 - 28: avg pos 11.8; Apr 28 cracking the top 10 for the first time at avg position 9.1; plus a 9-day rebound from a 3-site duplicate-content penalty) is the empirical anchor for every projection on the page. Tier 1-3 projections scaled by tier-difficulty coefficient from the Tier 4 cold-start. All multipliers in the table below are measured from a Position 18 baseline (top of page 2). Lower bound of each band = our measured engine velocity. Upper bound = industry-typical timeline when the client provides reduced content/material support. Ranges are deliberately wide. We choose under-claim over over-claim. Full disclosure on /marketing/proof/.

BASELINE Position 18 · Top of page 2 of Google · all multipliers below are measured from this starting point
Tier Verticals Pos 18 → Pos 10 Speed %ile +6 mo +12 mo +18 mo +24 mo
Tier 1
Light
Mobile and experiential marketing Event services Weddings and entertainment Niche specialty trades Hyper-local home services Pool and spa Pressure washing Tree services
1 to 4 months
floor · ceiling
Top <1%
vs typical agency
Pos 6–8
3–4× traffic
50–150 kws · top 10
15–40 kws · top 5
Pos 4–6
6–8× traffic
150–400 kws · top 10
50–120 kws · top 5
Pos 3–5
10–14× traffic
300–700 kws · top 10
100–250 kws · top 5
Pos 2–4
15–20× traffic
500–1,000 kws · top 10
200–500 kws · top 5
Tier 2
Moderate
Moving and relocation Hospitality Regional retail and e-commerce Residential cleaning Pest control Auto detailing Residential HVAC Residential plumbing Residential roofing Residential general contractor Residential concrete Residential real estate Landscaping
1 to 6 months
floor · ceiling
Top <1%
vs typical agency
Pos 7–9
3–4× traffic
40–100 kws · top 10
10–30 kws · top 5
Pos 5–7
5–8× traffic
100–300 kws · top 10
30–100 kws · top 5
Pos 3–5
9–12× traffic
250–600 kws · top 10
80–200 kws · top 5
Pos 2–4
13–18× traffic
400–900 kws · top 10
150–400 kws · top 5
Tier 3
Heavy
Legal Accounting and CPA Commercial construction Commercial concrete Commercial roofing Commercial HVAC Commercial plumbing Commercial cleaning / janitorial Architecture and engineering Commercial real estate Regional B2B services Specialty consulting
2 to 8 months
floor · ceiling
Top <1%
vs typical agency
Pos 8–10
2–3× traffic
30–80 kws · top 10
10–25 kws · top 5
Pos 5–7
4–6× traffic
80–200 kws · top 10
25–70 kws · top 5
Pos 3–5
7–10× traffic
200–500 kws · top 10
70–150 kws · top 5
Pos 2–4
11–15× traffic
400–800 kws · top 10
130–300 kws · top 5
Tier 4
Heavy YMYL
Insurance and benefits Healthcare and medical practices Financial advisory and fintech Mortgage and lending Wealth management Telehealth
2 to 12 months
floor · ceiling
Top <1%
vs typical agency
Pos 7–9
4–5× traffic
20–50 kws · top 10
5–15 kws · top 5
Pos 5–7
7–10× traffic
50–120 kws · top 10
15–40 kws · top 5
Pos 3–5
12–16× traffic
100–250 kws · top 10
35–90 kws · top 5
Pos 2–4
18–24× traffic
200–500 kws · top 10
70–180 kws · top 5

Every Google rank, what it’s worth to you.

Pick your industry, type your city. You’ll see the tier we’d put you in, the page-2-to-page-1 speed our engine projects, and — anchored on live SEMrush keyword volumes for your metro — the annual gross profit at every Google rank from 10 to 1. Climbing one rank is real money. See yours.

Before our innovative system Measured
Quality percentile
Projected after our innovative system Projected
Quality percentile
Pos 18 to pos 10 (speed)
Page-1 share, mo. 12

Position-by-position math
What each Google rank is worth in your market.

Editable assumptions for your service area. Annual gross profit at each average Google position across your money keywords.

Top 50 US metros
Type your city above
Click -> lead
Lead -> deal
Per closed deal
We don't have that city on file yet for this industry. Run the audit calculator to get your real number for your domain, then enter it here manually.
Avg positionCTROrganic clicks / moClosed deals / yrAnnual gross profit

Math. clicks/mo = universe x CTR (AWR 2024 SERP study). leads/yr = clicks x clicks-to-lead x 12. deals/yr = leads x close rate. profit/yr = deals x profit per deal. Universe basis: explicit-geo SEMrush head x 4 (Whitespark + Local SEO Guide composite). Edit any input above to lock to your numbers.

Three things no SEO/marketing agency will put in writing.

If a competing agency offers all three, sign with them instead. We've yet to find one that does.

Differentiator 1

5-of-7 ranking guarantee.

Hit at least five of seven ranking metrics in 90 days, or every retainer paid to date refunds — full, 100%. In writing, in the term sheet.

Differentiator 2

30% profit cap.

Total annual fees never exceed 30% of the new profit we drive into your business. Your upside is always at least 70%, by contract.

Differentiator 3

One client per subvertical, per metro.

Territorial exclusivity in writing. Your direct competitor cannot also be our client — not now, not later.

Why most service-business sites cannot crack page 1.

Three things are true on almost every page-2 service-business site we audit. We fix all three.

Thin content depth.

Operators ship 800-word service pages. Google ranks 2,500-word entity-rich pages. The depth gap is most of the visibility gap.

Local Pack invisibility.

Ranking organic without Top-3 Local Pack inclusion is half a win. Map clicks beat blue links for "near me" queries every time.

Schema and EEAT gaps.

Missing LocalBusiness, Service, FAQ schema. No author entity. No verified business signals. Google reads this as low trust.

We fix all three. Predictably. See the 3 packages →

30-second ballpark. Audited number in under a minute.

Drag three sliders, click your current Google rank, and you have a Year-1 plus Year-2 profit estimate instantly. Then enter your domain. We run a live Lighthouse and on-page SEO audit on your real site and lock the projection to actual data. Every input is editable, every line item is shown. No phone number. No name. Email only if you want the PDF.

1

Audit your live site

Enter your domain and service area. We run a real Google Lighthouse audit and parse your on-page SEO in roughly 25 seconds. Performance and SEO scores from your actual site, with the "after Benefitra" target shown beside each.

2

See the math, not the marketing

Service-area search volumes. Month-by-month profit chart (24 months). Search-position curve from today to month 12. Time-to-page-1 estimate. Receipts table for every dollar and every lead.

3

Pick your tier

Three packages with Year-1 plus Year-2 profit and ROI multiples computed against your numbers. ROI updates as you tune. Book a discovery call when you are ready.

Ballpark math is instant. The full audit takes roughly 25 seconds. No phone number or name required. Email only if you want the PDF report.

Free marketing audit

What is your website actually worth over the next 2 years?

Enter your domain and service area below. We run a real Lighthouse + on-page SEO audit on your live site in 30 to 90 seconds, then surface a 24-month profit projection locked to your actual site performance. No phone number, no name. Email only if you want the PDF report.

Compare against your competitors Enter 1 to 3 competitors. We audit them on the same signals so you see exactly where you stand. Not canned benchmarks — real audits of the domains you name.
Audit scope Sitewide pulls your sitemap.xml, audits up to 25 pages with cheerio, runs Lighthouse on the homepage + 4 sitemap-priority leaders, and reports the median score. Homepage-only audits just / — faster, less complete.

30 to 90 seconds depending on scope. We run a live Lighthouse audit, parse your on-page SEO, and pull live competitive-keyword data for every domain you enter. No phone number, no name. Email only required if you want the full PDF.

--
90after Benefitra+48
Performance ?What this measures: how fast your site loads. A real Lighthouse run by Google's open-source auditing engine against your live homepage — scores Largest Contentful Paint, Cumulative Layout Shift, Total Blocking Time, and 30+ other Core Web Vitals signals on a 0 to 100 scale. This is about TECHNIQUE, not rankings. A site can have great rankings and a low Performance score (slow site that ranked anyway), or a perfect Performance score and zero traffic (fast site nobody visits). 0 to 49 poor (red), 50 to 89 needs improvement, 90 to 100 good. Google uses this as a ranking signal — fixing it directly impacts where you rank.Source: Lighthouse 12 (developer.chrome.com/docs/lighthouse), Google Core Web Vitals docs
Loading speed · technique, not rankings
--
95after Benefitra+35
On-page SEO ?What this measures: whether your code follows search-engine best practices. A live DOM parse of your homepage HTML, scoring 9 fundamentals: title tag, meta description, H1 presence, canonical URL, schema.org markup, image alt coverage, word count, internal link structure, and heading hierarchy. Each is binary pass/fail — reading your real markup, not estimating. This is about TECHNIQUE, not rankings. A site can have perfect on-page SEO and still be on page 5 because it lacks backlinks, content depth, or domain authority. Below 60 means search engines are confused about what your page is — fixing this is necessary but not sufficient.Source: Google Search Central, search-engine-optimization-starter-guide; Schema.org spec
Code quality · technique, not rankings
--
75after Benefitra+--
Organic traffic captured ?What this measures: the actual traffic your site is currently getting from Google's organic results — measured, not modeled. Sourced from a paid keyword index that aggregates SERP data across your full ranked-keyword footprint. This is about OUTCOMES, not technique. The other two rings (Performance, On-page SEO) are inputs you can fix; this one is the result of those inputs compounding over time, plus your keyword strategy, plus your content depth, plus your backlinks. A site can have Performance 95 + On-page 95 and still score low here because the rankings haven't compounded yet OR the targeted keywords have low search volume. Score scale: 0–20 = under 50 visits/mo, 45–70 = 250–1,000 visits/mo, 88+ = 5,000+ visits/mo, with a small bonus for keyword breadth.Source: third-party search-data API; results sampled from US-database keyword index
Actual visits/mo · outcome, not technique

How this audit works. When you hit Run scan, this server fires three real audit engines in parallel against your live domain and each competitor you named. Engine 1: a full Google Lighthouse pass, the same engine that powers PageSpeed Insights, scoring 30+ Core Web Vitals signals on Performance, Accessibility, Best Practices, and SEO. Engine 2: a cheerio DOM parse covering nine on-page SEO fundamentals (title tag, meta description, H1 hierarchy, canonical, schema.org markup, image alt coverage, internal linking, word count, HTTPS). Engine 3: a live keyword-data lookup against a paid third-party search-volume index, restricted to the metro you typed (or US-wide if you typed Nationwide). Total runtime: 60 to 120 seconds depending on competitor count and site size. Nothing is mocked, nothing is averaged from a database. Every score on this page is a real measurement against your live URLs, this minute. Refresh and re-run; the numbers will move with your site.

Scope: this is a sitewide audit, up to 25 pages per domain. For each domain we read your sitemap.xml (falling back to sitemap_index.xml, then to a homepage link-walk if neither exists), pick the top 25 pages by sitemap priority, and run the cheerio on-page audit against every one of them. Lighthouse runs on the homepage plus four highest-priority interior pages (the expensive engine is rationed by design). Per-domain SEO and Performance ring scores are the median of the per-page scores, so a single great or terrible page can't skew the result. The Top-5 finding panel and homepage screenshot below stay anchored to your homepage, since title text, meta tags, and the <head> markup are page-specific evidence.

What we cover when you book the call. The same audit engines, run across every URL on your site (not just the top 25), plus Google Business Profile health, NAP citation consistency across 30+ directories, the keyword set we'd actually target for your service area, your competitors' link profiles, and the pages we'd build (or rebuild) to fill the gaps. Same three engines, just everywhere they should run.

What you do with the Top-5 list above. If you have an in-house dev or a marketing person who can execute, the recipes are complete enough to act on directly: what to change, where, and why. Most owners can't or won't, and that's where we come in: same priority order, executed for you in 30 to 60 days, with weekly reporting hooked into the same dashboard you're looking at now. Your audit data, your roadmap. The package selector below maps directly to it.

Sources: Lighthouse 12 (Google, open source), Google Search Central, SEO Starter Guide, Advanced Web Ranking 2024 CTR study, schema.org LocalBusiness specification, web.dev Core Web Vitals reference.

Market demand · Google searches in your service area

How big is the pie in your city?

Before we project your slice, let's anchor the size of the pie. This is the addressable monthly demand on Google for the people who currently need a service like yours in your area, measured, not invented. ?We aggregate monthly search volume across the head terms a homeowner or property manager actually types when they need your service, plus the same queries with the city name appended. Volumes from public Google Keyword Planner data, calibrated against Ahrefs and SEMrush metro-level reports.Source: Google Keyword Planner plus Ahrefs/SEMrush 2024 to 2025 metro keyword databases

--
searches per month in your service area
--
Show top US service-business markets by monthly search volume (prove it isn't made up)
Step 1 · Your numbers

Tell us about your business.

Defaults are service-business medians. Drag sliders to match your reality.

$4,500
5
#18
3.0%
25%
Step 2 · Time, money, and headache

Your current marketing spend vs ours.

Three things you save with Benefitra: cash, your hours, and the mental load of running it all. Quick mode for a one-line answer; advanced if you want to see the breakdown.

6 / 10
It's fine I want to torch the agency
$3,000
8 hrs
Do you have (or are you about to hire) an in-house marketing person?
Financial, monthly
--
Your spend now vs Benefitra retainer for the package you select.
Replaces a hire
No hire flagged
If you toggle "Yes" above, we'll show what NOT making that hire is worth.
Time, weekly
--
We run the program. You approve content and pick up the phone.
    Frustration
    6/10 → 2/10
    You: send audio notes about your jobs. Answer a few questions. Us: everything else.
    • You no longer juggle web dev, SEO, content, PPC, GBP, reviews. One team.
    • You no longer schedule blog posts or chase missed deadlines
    • You no longer fight ad accounts at 7pm Friday
    • One report, one call, one thread. Not eight.
    Step 3 · Pick your program

    Our packages and what they will earn you.

    Three tiers. Each card shows the projected Year-1 and Year-2 incremental profit for your numbers above. Tap any feature row inside a card to see the math.

    Step 4 · Where you'll be in 90 days

    Month 3 with Benefitra.

    First-90-day milestone. The fastest-moving inputs (CWV fixes, GBP claim, link velocity, content cadence) compound here before the long-tail keywords mature.

    Search position
    --
    --
    Extra leads / mo
    --
    vs your baseline today
    Extra sales / mo
    --
    leads × close rate
    Incremental profit / mo
    --
    sales × profit per job
    --
    Step 4 · Year-1 + Year-2 trajectory

    Month-over-month total profit, three trajectories. i

    Three lines, one comparison. Gray dashed = your current trajectory if you change nothing. Purple = what the old engine would deliver for your tier (anchored on the matched real-client GSC trajectory). Orange = what the new engine projects. The vertical guide marks Month 12.

    Current trajectory (do nothing)
    Old-engine trajectory (matched-tier prior system)
    New-engine trajectory (with Benefitra)

    Search position curve (organic rank, lower is better)

    Current trajectory: what you'd see if you change nothing (same data as the receipts table column)
    Old engine: our prior system (matched-tier real-client GSC trajectory)
    With Benefitra: new engine (matched-tier projection · 75% CI band)
    Gold band + dashed line: Published time-to-pos-10 window for your tier (calibrated from a #18 baseline)
    Today
    --
    Month 6 · new system
    --
    Month 12 · new system
    --
    Tier
    --
    Line 1 — your current trajectory your measured signals

    Run the audit to see the real signals we measured on your site that produce this curve.

    Line 2 — old engine, your matched tier measured prior-system GSC data

    Anchored on a real client's measured Google Search Console trajectory under our prior system, in the same tier as your business.

    Line 3 — new engine projection tier-anchored 75% confidence band

    Calibrated against PEO4YOU's measured Mar–Apr 2026 breakout under the new engine, scaled to your tier.

    What we'd do for you with-Benefitra activity

    Pick a package below to see exactly which activities feed the orange line.

    Step 4 · Month-by-month proof

    The receipts: 24 months, three trajectories side by side.

    Three monthly profit columns, one comparison. Current trajectory = what your business earns from search if you change nothing. Old engine = what our prior system would have delivered for your matched tier (anchored on the real-client GSC trajectory). With Benefitra = what the new engine projects. The gap column is dollars you leave on the table by waiting. No marketing math, no rounding tricks. Same model that drives the chart.

    How we got these numbers

    What's measured vs. what's modeled.

    Estimated additional profit with Benefitra
    $--
    Based on the numbers above. The projection updates instantly as you adjust.
    Extra leads / mo (steady state)
    --
    Extra sales / mo (steady state)
    --
    Extra revenue / mo (steady state)
    --
    and that's not counting:
    --
    your hours / week back
    redirected from marketing to jobs
    🔥
    --
    frustration level
    scale of 1 to 10, your input vs Benefitra workflow
    🎙
    Send audios.
    Answer questions.
    your job
    monthly voice notes about case studies plus quick approvals on content
    📥
    1 retainer
    replaces 4 to 7 vendors
    no more agency, freelancer, content, PPC, GBP, review-tool sprawl
    Still an estimate. Even with your live audit data, this projection runs on industry-calibrated ramp curves and the numbers you set in Steps 1 and 2 above. The closer those numbers match your reality, the closer this projection lands. Keep tuning. Every input is a slider, and every line item is shown in The receipts table above. You also gain the time and frustration drop on the right; those alone are why most owners make the switch even before the profit lift.
    The Two Guarantees

    Process and outcome. Both guaranteed.

    Process — 5 of 7

    Hit 5 of 7 ranking metrics in 90 days, or every retainer refunds. Plus First Win in 30 days, or first month free.

    Profit — 70% to you

    Total annual fees never exceed 30% of new profit driven, or we refund the difference. Your upside is always at least 70%.

    Both guarantees apply on every package. Full §3 (process) and §5.9 (profit) mechanics in the term sheet. Annual reconciliation; refunds cascade from performance fees first.

    Want the full breakdown sent to you?

    PDF version of everything above plus failed audits, top 3 competitors in your service area, exact keyword gaps, and a tier recommendation. We email it once and don't add you to anything.

    Projections derived from your inputs and service-business benchmarks. Actual results vary by execution quality and market conditions. Numbers refine continuously as we collect performance data on your account.

    Pick the engine. We run it.

    Three packages. Core runs one engine — toggle SEO or PPC below. Growth fires both. Total adds full outbound. All come with managed hosting and website management at no extra cost.

    SEO Core
    $2,500/mo
    Plus 5% of increased inbound revenue (not your existing revenue). Cap $5,000/mo. Total fees cap $7,500/mo.
    Months 1 to 3 at $1,000/mo
    • SEO and content engine
    • Google Business Profile management
    • Local citations and directory work
    • Link acquisition
    • LinkedIn organic
    • Email nurture pipeline
    • Cross-AI quality control
    • Daily blog pipeline
    • Bilingual content
    • Industry-specific topical authority
    Bundled free: managed hosting, website management, Free Refresh redesign on 24-month term.
    Free Refresh remaining: 25/25

    First win within 30 days OR first month free.

    5 of 7 in 90 days. Miss 3 plus, full refund.
    Total fees capped at 30% of new profit. Or we refund the difference.
    See if this fits
    Growth
    $4,500/mo
    Plus 5% of increased inbound revenue (not your existing revenue). Cap $7,500/mo. Total fees cap $12,000/mo.
    Months 1 to 3 at $2,500/mo
    • Everything in SEO Core
    • Paid acquisition (Google LSA, Google Ads)
    • CallRail call tracking and scoring
    • Reputation engine
    • Project gallery automation
    • Ad spend pass-through plus 10% management fee
    Bundled free: managed hosting, website management, Free Rebuild redesign on 24-month term.
    Free Rebuild remaining: 12/12

    First win within 30 days OR first month free.

    5 of 7 in 90 days. Miss 3 plus, full refund.
    Total fees capped at 30% of new profit. Or we refund the difference.
    See if this fits
    Total Marketing
    $7,500/mo
    Plus 5% of increased inbound revenue (not your existing revenue). Cap $10,000/mo. Total fees cap $17,500/mo.
    Months 1 to 3 at $4,000/mo
    • All marketing features included
    • Outbound sequences (email and voicemail)
    • Field rep enablement (where applicable)
    • B2B and partner outreach
    • Financing widget (where applicable)
    • Referral program
    • Bilingual landing pages
    Bundled free: managed hosting, website management, Free Custom redesign on 24-month term.
    Free Custom remaining: 5/5

    First win within 30 days OR first month free.

    5 of 7 in 90 days. Miss 3 plus, full refund.
    Total fees capped at 30% of new profit. Or we refund the difference.
    See if this fits

    Pricing-lock at signing. Q3 cohort retainer is $2,500/mo for SEO Core. Q4 may adjust as the calculator-driven results bank scales. Lock your rate at signing.

    12-month exception available at plus $450/mo premium. No free redesign. Offered only on prospect refusal of the 24-month term.

    Multi state, multi DMA, franchise, or nationwide

    The three packages above are calibrated for single DMA service businesses. If you run multiple states, a franchise rollout, or a vertical portfolio, the work and the economics are scoped on a call. Same engine, same guarantees, same one slot per subvertical rule. Pricing reflects the surface area, not the tile.

    Book a scoping call

    Questions, answered straight.

    How fast does SEO actually work for service businesses?
    Our First Win milestone is at least one money keyword on page 1 within 30 days. Our 90-day target is 5 of 7 ranking metrics. Full lift to consistent page-1 across the keyword set typically lands on the timeline shown in our tier projection chart: 1 to 4 months for Tier 1 verticals, 1 to 6 months for Tier 2, 2 to 8 months for Tier 3, and 2 to 12 months for Tier 4 YMYL categories. Floor of each band = our measured engine pace (peo4you.com cold-start at 71 days); ceiling = industry-typical when client content cadence runs low. We model the band on the calculator output.
    How is this actually different from a generic SEO agency?
    Three things. One: the program is built by Juan Reyes, an operator with 17 years in the trench (ex-Vensure), not assembled by a junior account-manager rotation. You meet the operator on the discovery call and they architect your engine. The day-to-day is then run by a tooled team executing that playbook. Two: we put a contractual guarantee on ranking metrics with a 100% refund if we miss. Almost no agency will sign that page. Three: we cap at one slot per subvertical per service area, so we will not sign your direct competitor. The pricing also reflects an operator-with-tooling model, no overhead from a sales / AM / PM / QA stack you do not need.
    Will I have to write the content?
    No. You send us voice notes about jobs you have completed. The address, the problem, what you did, what you would warn the customer about. We get to work. We transcribe, structure, source the photos, write the article, add the schema, build the internal links, and ship it. You approve. That is the entire content workflow on your side.
    What does my actual week-to-week involvement look like?
    Light. You send us voice notes about jobs you have completed when you have them. We turn each into a piece of content. You approve drafts as they come up via email or Slack. There is a monthly review call where we walk through the previous month's metrics and the next month's plan. Everything else, keyword research, on-page fixes, GBP, reviews, ad accounts, hosting, the website, is on us.
    My industry is regulated (insurance, healthcare, legal, financial). Does this still work?
    Yes, with a longer runway, and the proof case for it is our own client peo4you.com in regulated employee benefits, the same Tier 4 YMYL class as health, financial advisory, and mortgage. From February 2025 through February 2026, thirteen straight months, peo4you sat at average Google search position 39.5. Bottom of page 4. Bottom slice of its vertical. 286K impressions and 773 clicks across the entire window. Then in March 2026 we deployed the new automation engine. Mar 1 - Apr 14: average position climbed to 14.3 across 116K impressions and 316 clicks. Last 16 days (Apr 12 - 28): average position 12.6 across 47.1K impressions and 133 clicks. Last 7 days (Apr 22 - 28) tightened further to average position 11.8 across 22.6K impressions and 51 clicks, with Apr 28 cracking the top 10 for the first time ever at average position 9.1. Plus a 9-day rebound from a 3-site duplicate-content penalty in the same window. The runway for Tier 4 is 2 to 12 months (floor to ceiling) to lock in the climb from position 18 to position 10 across the full keyword set. The 5 of 7 guarantee applies to all tiers. The chart and tier table above show how the curve compounds.
    What if I am already on a contract with another agency?
    We do not poach mid-contract. If your current agency has 90 days or less remaining, we can start a parallel content runway so you do not lose months. If you are signed for longer, we will tell you to ride it out and earmark a slot in the next quarterly cohort.
    Why a 24-month term?
    SEO compounds. Cutting the relationship at month 6 or 12 throws away the position lift we just built. The 24-month term aligns our incentive with yours. We earn back our reduced introductory pricing only if the SEO actually works. The free redesign is your reward for committing to the runway. A 12-month exception is available at a $450/mo premium and no free redesign.
    What exactly does the 5 of 7 guarantee pay out if you miss?
    We guarantee we hit at least 5 of 7 metrics in 90 days. If at the end of the audit window we hit 4 or fewer, every retainer paid to date refunds in full, 100%. There is no stair-step, no partial refund, no "we got close." Either we clear the bar or you get your money back. The full conditions, including the audit window, the metric definitions, and which metrics carry forward at the end of each quarter, are in the term sheet.
    Do you do paid ads, or only SEO?
    Both. SEO Core is organic-only. Growth and Total Marketing add Google LSA and Google Ads with CallRail call tracking. Ad spend is pass-through with a 10% management fee. We do not mark up ad spend.
    We are a Spanish-speaking shop. Do you offer Spanish content?
    Yes. Bilingual content is in every tier. Bilingual landing pages and Spanish-dominant funnels are part of Total Marketing. Output is published with hreflang tags so search engines route the right language to the right user.
    How do you measure attribution?
    CallRail dynamic number insertion on Growth and Total tiers. Form fills tagged by source via UTM. Google Search Console for organic ranking and click data. Local Falcon grid scans monthly for Local Pack presence on the agreed keyword set. We share a single quarterly review document.
    What if my site is built on a platform you do not support?
    If we cannot operate on your current platform, the Free Refresh, Rebuild, or Custom redesign on the 24-month term is your migration path. We rebuild on a stack we can fully operate (typically WordPress or a static-export framework with managed hosting we run).
    Do you guarantee a specific number of leads?
    No. We guarantee ranking metrics, because those are the upstream lever we control. Lead volume depends on offer, conversion rate on your site, seasonality, and competition. We project a band in the calculator, but the contractual guarantee is on the seven ranking metrics.
    What is the discovery call like?
    30 minutes. We pull your current GSC, Lighthouse, and schema audit on the call. We share our own GSC read-only so you can verify the proof numbers. We name a tier and a price. You decide. No high-pressure close.
    What does "one slot per subvertical per service area" actually mean?
    We work the same keywords, the same competitive set, the same conversion playbook for every client. Two clients in the same subvertical in the same service area would compete with each other for our outputs. So we lock the slot at signing and we will not sign your direct competitor for the duration of the contract. Subvertical means the actual demand pocket you sell into. Roofing residential is a different subvertical from roofing commercial. Family law is a different subvertical from estate law. We will be specific about the boundary on the discovery call so the protection is real.

    Show up at the top of Google twice.

    Book the discovery call. Bring your money keywords. We will run the audit live on the call.

    Book the discovery call →

    Not ready to talk? Run the free instant SEO + PPC audit — no email required.

    One slot per subvertical per service area, we will not sign your direct competitor · 24-month term · 5 of 7 ranking guarantee, miss 3 plus refunds 100%

    Juan Reyes · 17 years SEO/PPC, ex-Vensure · running this engine. LinkedIn →

    Ready to see this engine on your service business?