Real Benefitra client · Tier 2 anchor · Before our newest engine
Tier 2 anchor · moving and home services

Moving and home services. Page 3 to page 1 in 13 months.

We held this site at average position 25 to 30 for 13 months while we built the technical and content foundation, then it broke through to page 1 on 2026-02-01 and held it. The 16 month cumulative result, all measured by Google Search Console on the client's own domain. This was our prior process, not the new engine. One slot per subvertical per service area, we will not sign your direct competitor.

16 months of compounding, on the client's own domain.

Every number below traces back to Google Search Console, exported from the Tier 2 client's property. Window: December 2024 through April 2026.

27.4 to 9.3
+18 ranks
Average position lift across the full 16 month window. Page 3 territory to page 1.
30,989
cumulative
Total clicks from Google search over the window. Real visitors landing on the site.
4.04M
cumulative
Total impressions across the same window. The site shown in front of millions of searchers.
70%
page-1 share
Share of THIS client's clicks that now arrive from page-1 placements on Google. Not an industry average. Their own measured share.
0.77%
CTR
Click through rate across the window. Honest, mature, regional services CTR with the headline and metadata work in place.
13 mo to 0
breakthrough
Held on page 2 and page 3 for 13 months while content and technical foundation built. Broke through to page 1 on 2026-02-01 and held it.
Google Search Console performance chart for the Tier 2 anchor (moving and home services). 31.4K clicks, 4.12M impressions, 0.8% CTR, average position 11.4 across the 16-month window. Position trajectory 27.4 to 9.3.
Click chart to enlarge · Google Search Console export, 12/2024 → 04/2026

Source: Google Search Console export, the client's own property, 16 month observation window. Result captured before the new automation and process work that now powers our retainers.

Where the top 1,002 queries actually rank today.

Average position is one number. The full distribution tells the real story. 70% of this Tier 2 client's top thousand queries sit on page 1 of Google. Nothing in the bottom slice. That is the shape of a foundation that compounds.

Position band Queries Share of top 1,002
Position 1 to 3 115 11.5%
Position 4 to 10 586 58.5%
Position 11 to 20 247 24.7%
Position 21 to 50 54 5.4%
Position 51 and below 0 0%

Top single query: the client's brand term at average position 1.3 with 568 clicks. The brand term is locked. The category terms are compounding around it.

How we got here.

Moving is a Tier 2 vertical. Fragmented field, regional intent, mostly unoptimized incumbents. The opening is real but it does not come fast. The job is to build a technical and content foundation that Google can trust, then keep stacking authority until the algorithm has no other rational ranking to give you.

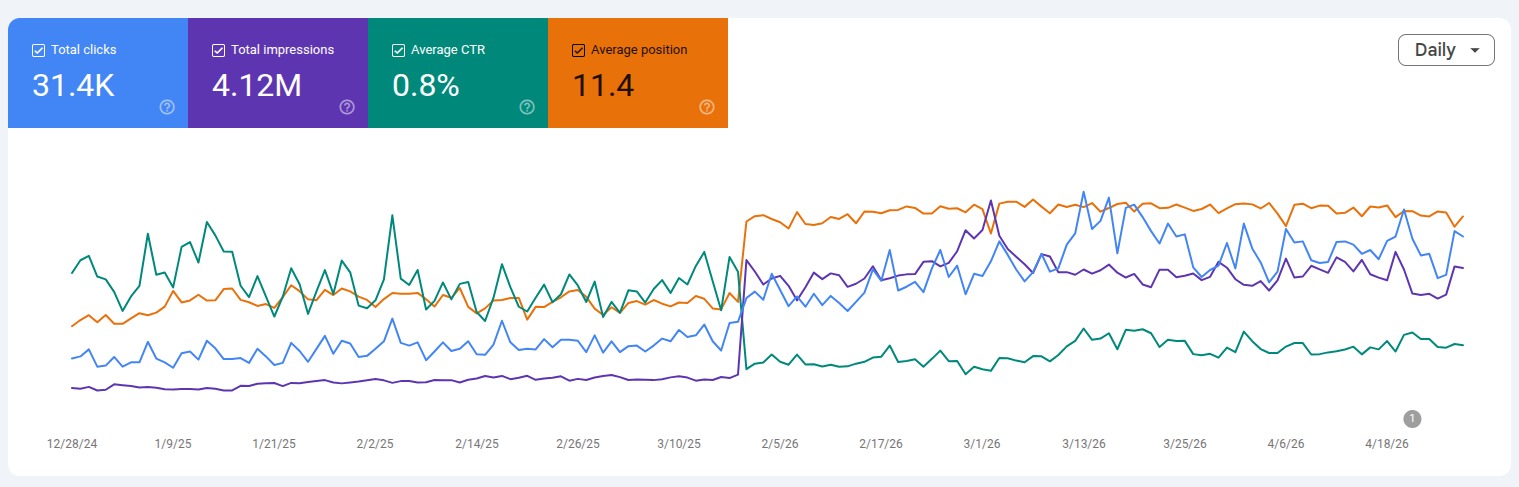
We took this Tier 2 client on with that posture from day one. The first 13 months of the engagement, average position sat between 25 and 30. Page 2 to page 3 territory. To an outsider, that looks like nothing is happening. To us, it is the foundation pour. Site architecture, internal linking, schema, page speed, every category and service template rebuilt around real searcher intent, content depth on the queries that actually convert. The work that does not show on a chart until it does.

On 2026-02-01, the site broke through to page 1 and held it. The position trajectory bent from 27.4 down to 9.3 over the full 16 month window. Today, 70% of THIS client's clicks come from queries where their site ranks on page 1 of Google. Nothing in the bottom of the distribution. The top branded query sits at position 1.3 with 568 clicks. Every category term we targeted sits in the page-1-to-low-page-2 band, compounding.

The hard part of this case is not the breakthrough. It is the 13 months of holding the line while the foundation set. Most agencies do not get that runway, because most agencies cannot articulate what they are doing during it. We can. This is what a Tier 2 build actually looks like, with measured numbers, on a real client, with the prior process. The new automation engine that we now ship on every retainer was not even running during this window.

Source data

All figures on this page are pulled from Google Search Console exports for the Tier 2 client's property. Full raw export tables and methodology live on the proof page.

See the full GSC exports and methodology →

Two more anchor cases, two more tiers.

Moving and home services is the Tier 2 anchor. Same operator, same playbook, applied across two more difficulty tiers below.

Sitting at position 18 today?

This is what page 3 to page 1 looks like in a Tier 2 vertical, measured on the client's own domain. If your site is in this neighborhood right now, the path forward is the same. Book the call and we will walk through the timeline for your specific industry and service area.