2027 Health Plan Funding Simulator Methodology
How the 2027 edition of the Benefitra Funding Simulator works, and what it can't tell you
This page details how the main Benefitra Funding Simulator works using planning rates for the year 2027. This simulator runs through your group's next five years thousands of times, pricing each way to finance a health plan according to its own rating and renewal rules. Results are a range of likely costs rather than one forecast.
This guide is written both for employers ranging from about 5 to 500+ employees and for brokers and advisors that work with them. It explains where the math runs, how each funding option renews, how renewal defaults are chosen for 2027, where the risk comes from, how to read the scenarios, and where the model has limitations.
1. What the tool does and which edition you are using
Choosing how to finance a group health plan is as much a decision about risk as about price. The same benefits can be provided through very different financial structures, and each one brings its own mix of predictable cost, upside if the claims year goes well, and exposure if it goes badly.
Tell us about your group. Its size, state, average age, and how much you pay right now. The simulator figures out approximately how much each funding path is likely to cost in the next five years, including the unlucky years that might happen, and how renewal looks likely for each one.
Which edition you are using
The main simulator runs on 2027 planning rates. We keep the 2026 edition at /funding-simulator-2026/ so you can compare. Each edition uses its own year's rates and renewal assumptions.
See also the 2027 simulator · the 2026 methodology · how the funding types differ & which fits your risk · stop loss & self funding rules by state.
2. Where the math runs, and what leaves your browser
When you click run, your group level inputs (the state, size of the group, average age of members, premium amount, and optional claims totals) are securely sent to Benefitra's pricing server. That server then runs the simulation and sends the results back to you. Census and claims files are read straight in your browser and never uploaded at all.
What leaves the browser from a claims file. When you upload a claims file, what we actually send are summaries. We send your average monthly claims along with your trend, and for each large claimant only the category of their condition, the dollar amount and whether it is still ongoing. We never send names, birth dates, member IDs or any row of your file. Files containing a name column are rejected outright.
This page explains what the model does using simple words. We don't publish the formulas that the model uses.
3. The eight options and how each one renews
The engine prices seven funding arrangements via the full simulation and allows you to add an eighth, an ICHRA benchmark, just by pressing a button. Each arrangement has its own rating rule and its own renewal behavior. The tool never treats any two as the same path.
| Funding type | How it is priced | How it renews in the 2027 edition |
|---|---|---|
| Small group Fully Insured | Community rated. Your group’s claims don’t move the price | From the Benefitra Renewal Index for your state and planning horizon, or a filed rate where one exists (Section 5) |
| Large group Fully Insured | Experience rated, blended toward the carrier’s manual rate by group size | On your own claims, weighted by how credible your group’s experience is |
| PEO | The PEO’s own rating curves. The PEO reunderwrites your group | Around a national average of about 13% a year, with occasional much larger jumps |
| Taft-Hartley | Pooled trust. One renewal for everyone | About 8% a year over a one to three year view and about 7.5% a year over five years, with a realistic range of about 1.5 points |
| MEWA | A pooled band, or experience rated on your own claims | Depends on the pool’s size, age and reserves, or on your own claims when experience rated |
| Level Funded | Self funding inside a carrier package, underwritten at setup | On the package’s own basis, with part of a good year’s surplus refunded |
| Self Funded | Your own claims up to the stop loss deductible, plus stop loss and fixed costs | On your own claims and your stop loss terms |
| Self Funded Captive | Self funding plus a partly refundable pooled layer | On your own claims, with part of the pooled layer returned in good years |
| ICHRA | Employer cost benchmark against the individual market | Not simulated. Shown as a fixed comparison |
PEO
PEO renewals are modeled close to an annual national average of around 13%, with some years seeing much bigger jumps, because a PEO reunderwrites your group. Because PEOs pool members across the country as a whole, the default isn't state specific. You can replace it with the actual renewal rate from your PEO.
Taft-Hartley
Taft-Hartley trusts renew as one pool. So every employer gets the same increase. In the 2027 edition we expect renewals to average about 8% a year if you're looking one to three years out, and about 7.5% a year over five years, with a realistic range of about 1.5 points around those figures. Where do these numbers come from? Our research on national multiemployer plans, not small group state rate filings. The 2026 edition centers Taft-Hartley renewals at about 3% a year.
MEWA
The range of a MEWA depends on the number of employers, the ages of members, and how many months of claims are set aside in reserve. Pools that are larger, younger and better reserved tend to move less. Another option is switching a MEWA to experience rating. This lets renewals depend on your own claims rather than those of the pool.
Level Funded and Self Funded
Both are ways to self fund, and the tool prices and renews each one separately. Level funded plans refund part of a good year's surplus. We default that to 50%, though it varies by insurer. The aggregate corridor defaults to 120% of expected claims. Self funded plans pay their own claims up to a per person stop loss deductible, plus fixed costs and the stop loss insurance premium. And an aggregate attachment limits the worst year.
A level funded package is how smaller employers most often self fund. That's why the tool shows Level Funded by default for groups of 100 or fewer lives, and Self Funded above that. Want to compare the two? You can switch.
Self Funded Captive
The captive option starts at 20 enrolled employees. You can input the captive layer premium, the share typically returned in a favorable year, and any pharmacy rebate as well. Let us know if those returns have already been included in your quotation.
ICHRA
The ICHRA option lets you compare employer cost against the individual market using a button. You decide the employer contribution, anywhere between 50% and 100%. This comparison is fixed and doesn't simulate a path like the other seven options.
State rules
The tool follows the laws of each state. If a state restricts small group stop loss coverage, and therefore self funding, those paths are removed from your comparison rather than shown as if you could buy them. We also withhold the captive below its enrollment floor.
4. Community rating vs experience rating
In most states small groups are 1 to 50 employees. In California, New York and Vermont they're 1 to 100. Fully insured health insurance premiums in that range are community rated, so your group's claims don't affect your price. New York and Vermont go a step further and don't allow price differences by age.
The condition engine still works for a community rated group, but only to estimate your own expected claims for the comparison. It does not determine that price itself.
Large group fully insured plans and experience rated MEWAs move with your own claims. But they're weighted toward the insurer's manual rate by a credibility weight that depends on size. A single year from a 50 life group counts for only a little. From a 6,000 life group it counts in full. Level funded, self funded and captive plans are simply priced to your own risk.
The insight this tool is meant to reveal
Community rated fully insured charges every small group the pool's average. That means a healthier than average group is overcharged. It subsidizes the pool, and it can often price below that premium by self funding or level funding to its own low risk. A sicker than average group is undercharged, because the pool subsidizes it, so community rated fully insured health coverage is a real hedge worth keeping while the group is eligible. Put simply, healthy groups tend to self fund, and sicker groups tend to shelter in community rated fully insured. The tool works out which side of that line your group is on and tells you plainly.
5. How renewal defaults are chosen
For smaller groups we start with your state's history of filed small group renewals. You can override that number with either your own expectation or your insurer's renewal.
The Benefitra Renewal Index and your planning horizon
We ask how far into the future you are planning. For one to three years, our index looks at a recent weighted trend that leans on the most recent years. For a five year view, we look to the longer state average because it tends to hold up better when markets shift. If an insurer has already filed its rate for next year, we use that filed rate instead. When a carrier has only requested a rate, it is seen as a read on this year rather than a forecast for later years.
Which 2027 state rates are final and which are proposed
For 2027, some states have finalized rates for small groups while others still have proposed rates. The tool labels which is which. For states where the rate has been finalized, we use the approved statewide average instead of the proposed figure. If the rate is still proposed, then we use the proposed figure but label it as such.
As of this update, 2027 small group rates have been finalized in these 11 states.
- Connecticut
- Delaware
- Indiana
- Maine
- Massachusetts
- Nevada
- New York
- Oregon
- Pennsylvania
- Utah
- Vermont
All other states still use proposed 2027 rates. We will update this list as more states finalize.
6. Where the risk comes from
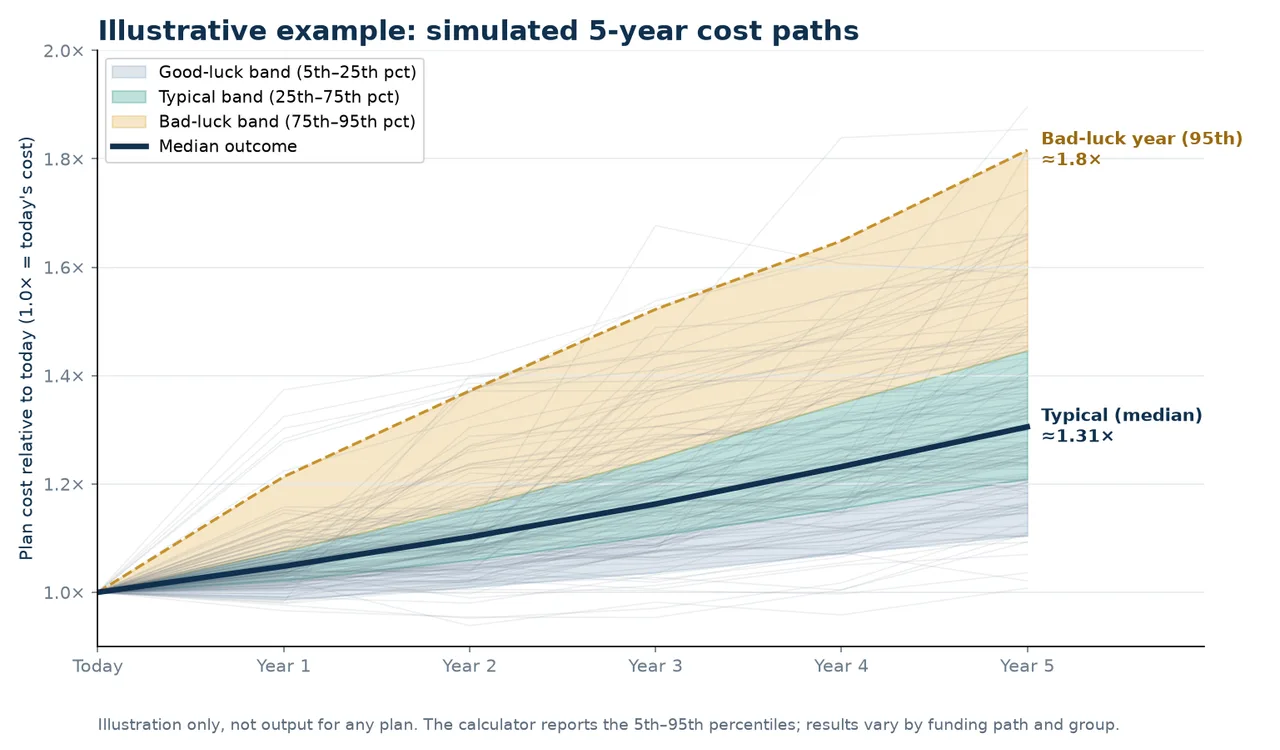
The engine uses a Monte Carlo simulation. Instead of just assuming one expected year of claims and then multiplying that number out, the engine simulates your group's next five years thousands of times. Each time it runs, it generates a different plausible outcome for claims. The range of results from all these runs together is the answer.
The condition incidence engine
Each year, for each member, the engine draws 17 named catastrophic conditions (solid and blood cancers, ESRD / dialysis, organ transplant, cardiac events, congestive heart failure, NICU / prematurity, hemophilia, MS, autoimmune disease, cystic fibrosis, one time gene therapies, major joint and spine surgery, stroke, and sepsis) plus a catch all “other catastrophic” bucket. Each one is drawn at that member’s age and health adjusted rate. Think about a 30 life group. It either has a catastrophic case this year or it doesn’t, and there's no smooth average that hides the lumpiness. Cases such as dialysis, cancer or transplant carry forward into later years, the way they would in a real book.
Three kinds of claims, plus a market wide swing
Claims for each simulated year combine a steady baseline of routine spending, a chronic component that rises and falls with the ordinary ebb and flow of a population's health, and the catastrophic component from the condition engine. Years with bad chronic claims tend to be followed by another one. Each simulated future also includes a market wide cost swing that hits all options equally.
High cost claims research, such as Sun Life’s High-Cost Claims and Injectable Drug Trends reports (listed in the References), shows that a small share of members accounts for a large share of overall health care spend. This is why most of the risk in health plan funding ends up in the tail and why the engine models it event by event.
What the condition engine does and doesn’t move. The model keeps the average catastrophe cost of each run tied to the group's expected budget. This means the per condition detail doesn't swing the typical year number much. What it does change is the shape of the bad year tail and the read on whether your group is healthier or sicker than the community pool.
7. Scenarios and percentiles
"At renewal" and "Two year totals" show four kinds of year. There's a good year (claims about 15% under expected), a bad year (about 15% over), a catastrophic year (about 35% over), and a single big claim (one $250,000 cancer case). The big claim view shows how each option passes a large claim through to your renewal. It also shows how self funded options can bring it down with specialty care programs.
In New York, the self funded cancer scenario is hidden from small groups and becomes visible only for groups larger than 100 employees. This matches the simulator's New York size rule for self funded options.
How many futures we run
By default we perform 5,000 simulations for groups with 50 or fewer and 2,000 for larger ones. You have a choice of running anywhere from 500 to 10,000. You can also total results across one to five years.
The percentiles you see
For each funding path the tool reports simulated costs at the 5th, 25th, 50th (median), 75th and 95th percentiles. Think of the 5th percentile as a good luck outcome, the 95th as bad luck, and the median as typical. The main cost charts stop at the 95th percentile, because past that point the extremes are too noisy to use as decision numbers. The cost containment chart is the exception. It also shows the 99th percentile, to show how containment acts on the most extreme simulated years. Treat that edge as a rough indication.
Trend to renewal, not just a five year total
For each funding path, the tool shows a projected average annual renewal alongside five year totals. This lets you see the path that sets the arrangements apart rather than only looking at where they are at the end of five years.
How this year's claims drive next year
Click any point on this year's claims curve and see what premium you might expect next year if that year of claims actually occurred.
8. Your inputs and what each one moves
The tool is designed to run on your numbers. Defaults act only as clearly labeled fallbacks (“Modeled”), and numbers that you type in are clearly marked as yours. If you leave claims blank, we estimate them based on your premium and an expected loss ratio that is labeled.
- Current premium and funding path. This sets the cost level that serves as the benchmark for every path, expressed in your own dollars.
- Census. The census collects the age of each member (along with gender if that's available). From that, we set each member's incidence rates and indicate whether your group is healthier or sicker than the community pool.
- Claims history. When you upload a claims history, you can allow trends in your own claims to shape future renewals for the options priced on your experience. Less data counts for less here. But the general market trend always carries meaningful weight.
- Last renewal. Your last renewal and the reason behind it help us understand whether that increase was a one off.
- Headcount growth. Do you expect your headcount to grow or shrink, as a yearly rate or year by year? Every simulated future follows the schedule you give.
- Stop loss terms. For self funded options, we also allow you to enter stop loss terms. There is the per person deductible (default $60,000), the aggregate attachment, any cap on stop loss renewal increases, a laser cap, and a no new laser promise. These terms affect how much one bad year can raise next year's cost. A cap on renewals controls what you pay for the stop loss insurance premium but does not limit total claims.
- Captive details. Premiums for the captive layer and the share it typically returns in a good year, along with pharmacy rebate, and whether or not those returns are already included in your quote (Section 3).
- Quotes. Enter any real quote and every chart recalculates on your number. You can also add up to three more quoted arrangements and compare them side by side.
- Advanced catastrophe settings. Advanced users have finer control over the network discount, the proportion of women and child dependents (which drive maternity, NICU and pediatric risk), and overall claim severity. To really get the most precise read, you should upload a census.
9. Cost containment
The 2027 edition includes an optional cost containment section for the self funded and captive paths. This section models clinical cost containment programs that a self funded employer could use to reduce the bad year spike. It does not name any vendors. It models the program type.
| Program | What it targets | Evidence |
|---|---|---|
| Centers of Excellence (COE) | Major surgical episodes, orthopedic / MSK, cardiac, transplant, some cancer surgery | Strong |
| Reference based pricing (whole plan) | Facility charges plan wide, benchmarked to a multiple of Medicare | Strong (price) |
| Direct cash pay | Routine and shoppable care bought at transparent cash prices, with a PPO backstop | Strong (price) |
| Specialty Rx management (conservative / aggressive) | Specialty & gene drugs, oncology drug slice, autoimmune biologics | Moderate |
| High cost / dialysis carve out | ESRD / dialysis and defined catastrophic conditions | Strong (dialysis) |
| Care navigation | Steerage, site of care, avoidable ER / readmissions / low value care | Moderate |
| Direct Primary Care (DPC) | Broad chronic / frequency reduction. Supports COE & navigation | Moderate |
Whole plan reference based pricing typically trims roughly 15 to 30% of total plan cost. Direct cash pay with a PPO backstop? Roughly 20 to 40%. But cash pay replaces the network, so it can't be combined with the other programs. And savings only come from the part of spend each program can realistically reach. Routine and fixed costs are never assumed away.
How it is modeled
- Read the realized tail. For every simulated year, the engine knows what conditions fired and what each one cost.
- Reach only what a program can touch. A program only affects the part of spend it can realistically reach. So COE gets the surgical slice, specialty Rx management gets the drug slice, reference based pricing and cash pay get the facility slice, and so on.
- Use a range, not a fixed number. The savings within that slice are drawn from a range and show up as uncertainty in the output bands.
- Stack on what is left. Programs apply one at a time to whatever remains, to avoid double counting for overlapping programs. We never treat more than 85% of any scenario's cost as containable.
Take a mid age group and turn on every applicable program. The modeled reduction in catastrophic tail dollars lands in roughly the 15 to 22% range. Centers of Excellence and the reference based pricing / direct cash pay price gap have the strongest evidence behind them. Care navigation and aggressive specialty Rx steering rest on softer evidence (more of it is vendor reported), and they carry patient access and legal caveats.
Read this as ranges rather than promises. Savings for each program are uncertain because they depend on your vendors, your population and how the program actually gets implemented. This section is about exploring what containment could do to your tail rather than projecting what it will do.
10. Recommendation, pricing basis and report
The five year, risk adjusted recommendation
The tool's "most likely to perform well over five years" pick is risk adjusted. For each eligible path, a score is calculated based on its expected five year cost, penalized by how much worse a bad luck run is than expected at your group's size. We also look at whether your own risk sits above or below the community pool. We give preference to the path that pairs a low expected cost with a contained downside instead of just picking the one that looks cheapest in an average year. State law can still override this recommendation. If self funding isn't available at your size, then we point you to the arrangements you can actually buy.
A plain language "why this wins"
This recommendation includes a written explanation of why a particular path is favored for your group. It covers your health relative position, your size, and your tail exposure.
Two pricing bases. Conservative vs documented client results
- Conservative model (the default). We price every alternative path using the data model described above, anchored to your own premium. This model doesn't assume that you achieve best in class results, and it is what you should base your planning range on.
- Documented client results (optional). A toggle reframes the alternatives to the average outcomes Benefitra has documented across its placements. Roughly, that's a PEO cost about 28% below fully insured (applied only at 50 or fewer enrolled, where that field evidence sits), a captive about 18% below fully insured, and self funded about 1% under the captive. This shows what actively managed groups have actually reached rather than a promise that yours will.
Regardless of the mode used, any real quote or current premium that you enter takes precedence over the modeled figure.
Benchmark context
The tool places your current cost per member against the KFF Employer Health Benefits Survey 2025. The national average single coverage premium was about $9,325/year, with small firms near $9,211 and large firms near $9,361.
Guided tour and PDF report
- Guided tour. A short guided tour gives you an overview of the inputs and explains what the output bands mean.
- PDF report. You can generate a PDF report of your run (email gated) that you can bring to your broker, CFO or advisor.
11. Data sources
- CMS Unified Rate Review public files, for state small group renewal history.
- State Department of Insurance 2027 filings, for 2027 final and proposed small group rates.
- State stop loss statutes, for which self funded options are available in each state (see stop loss rules by state).
- Milliman Medical Index and the AHRQ Medical Expenditure Panel Survey, for cost levels.
- Benefitra case studies, for the documented client results mode.
- Benefitra research on multiemployer trust renewals, for the Taft-Hartley defaults.
- The research sources listed under References.
12. Validation
We prefer showing an honest and partial track record over one that is polished and overstated. This is where validation stands today.
A preliminary, out of sample backtest
We replayed the funding decision using public market data from the KFF Employer Health Benefits Survey and the Peterson-KFF series from 2013 to 2025 as if we were making those calls at that time. We then scored whether the path the tool would have favored for each size band went on to deliver the better multiyear outcome. We set the definition of “correct,” the out of sample rule, and the size band segmentation before the run.
| Band | Tool's favored path | Directional verdict |
|---|---|---|
| Large (200+) | Self funded / captive | Supported, all proxies align. Large firms self fund and stay |
| Mid (50 to 200) | Self funded / level funded | Supported (directional) - clear migration off fully insured. Lower confidence than large |
| Small (<50) | Mixed. Level funded vs community FI | Not resolved, small group self funding actually fell as level funded rose. The tool's own conditional logic looks appropriate, but no clean win |
Treat this as a directional signal. It isn't a validated per employer hit rate. Aggregate public data can't honestly produce a single “X% accurate” number, and we publish the ambiguous small group result next to the strong large group one on purpose.
Underwriter review
Underwriter Borka Skoric has reviewed and validated the model's pricing logic, covering how each funding path is rated, how the incidence engine feeds the tail, and how renewals are projected. This is a working underwriting review rather than a formal actuarial opinion. Independent actuarial review remains a stated goal, and we don't claim that it has been completed.
The Renewal Index and the path to peer review
The Benefitra Renewal Index is built from state filed small group renewal trends. It's presented as a probabilistic prior with error bars, and never as a prediction of future healthcare costs. So what's the roadmap? Independent actuarial review first. Then a firmer segmented hit rate as per employer data becomes available, and only then a peer reviewed write up. We'll publish misses alongside hits at every stage.
13. Limitations, please read before you rely on this
A funding decision involves both health and money, and this tool is one input that goes into it, not the answer itself.
- It's decision support, not advice. It doesn't create an advisor client relationship, and it isn't an insurance quote. It also doesn't recommend a specific product for your specific circumstances. Treat every number as a modeled estimate, something to talk through with a licensed professional.
- It generates ranges rather than forecasts. Each output is a distribution of possibilities. The tool can't tell you what will happen, only what seems plausible across many simulated futures.
- It cannot predict individual claims. One unforeseeable catastrophic claim could put you well outside even the modeled bad year band.
- Its assumptions may not fit your group. Incidence rates, condition mix, cost distributions and renewal behavior have all been calibrated to population level research and typical groups. If there are any unusual demographics, industries, geographies or claims histories, the defaults may not fit well, so that's why this tool allows you to replace them with your own census and claims.
- Some 2027 rates are still proposed. For a state whose 2027 small group rate has not yet been finalized, the final approved rate could be different.
- Your files stay in your browser. Summaries go to our server. Census and claims files are read on your device and never uploaded, and name columns are automatically rejected. The simulation runs on Benefitra's pricing server, which receives your group level inputs and the claims summaries described in Section 2. Keep identifiers out of the file, and treat the file on your own machine as something you are responsible for.
- It is not a substitute for a licensed advisor or actuary. Real funding decisions need underwriting, real stop loss insurance quotes and plan document review. And they require professional judgment that this tool simply lacks.
- The cost containment estimates are modeled ranges. They depend on vendor performance and implementation. Some are backed by softer evidence, and several carry legal and patient access caveats.
- Data has lag and gaps. Data from public sources is periodic and lags behind the market. State rules change. Figures reflect the best public data available up until the last updated date.
- The validation is preliminary. The backtest is directional and built on public aggregates. It isn't a peer reviewed, per employer hit rate.
- Pooled structures carry risks that aren't modeled. For both MEWA and Taft-Hartley plans, the modeled range holds only while the arrangement stays financially healthy. The tool can't see whether a particular trust is solvent or how it runs its operations.
Bottom line. Use the simulator to frame the conversation and get a feel for the shape of the trade off. Then get a real quote, and talk to a licensed advisor before you decide.
Frequently asked questions
Is this an insurance quote?
No. The simulator produces modeled estimates for educational and decision support purposes. It is not an insurance quote, and it does not offer any guarantee or professional recommendation.
Which calculator should I use, 2026 or 2027?
Use the main simulator at /funding-simulator/ for 2027 planning. The 2026 edition at /funding-simulator-2026/ is kept for comparison and uses 2026 rates and renewal assumptions.
Why does it show a range instead of one number?
Health plan costs can change a lot from year to year. And the range? It shows good, typical and bad claims outcomes across thousands of simulated five year scenarios.
Do I have to upload my census or claims? Where does that data go?
No, but providing them makes the results more specific to your group. Uploaded files are read in your browser and are not uploaded. The simulation runs on Benefitra's pricing server, which receives your group level inputs and, if you upload claims, only summaries. Average monthly claims, trend, and for each large claimant the condition category, amount and whether it is ongoing.
Are the 2027 fully insured rates final?
In 11 states they are final. Connecticut, Delaware, Indiana, Maine, Massachusetts, Nevada, New York, Oregon, Pennsylvania, Utah and Vermont. Other states still use proposed 2027 rates, and the tool labels which is which.
How accurate is it?
The simulator uses public research, market data and reviewed underwriting methods, but results remain estimates. Its validation is preliminary and doesn't represent any guaranteed accuracy rate for individual employers.
Does the cost containment section guarantee those savings?
No. While savings ranges based on published evidence are shown, actual results vary depending on which program is chosen, the vendors, the population, and how it is implemented.
Why isn't self funding an option for my group?
Your state might limit small group stop loss coverage, or your group just may not be big enough for the minimum enrollment of some arrangements. The simulator removes options that might not actually be available legally or practically.
Should I make my funding decision based on this tool?
No. Use the simulator to get an idea of the possible costs and risks. Then review real quotes and talk to a licensed advisor, broker or actuary before deciding.
More on Health insurance funding
Related funding arrangement
- Funding arrangements compared: Fully-insured, level-funded, self-funded, captive, ICHRA, PEO and Taft-Hartley plans side by side.