Plain language summary
PEOs often quote an “average renewal,” but how do you actually figure out what that is? We haven't found any rule that says.
The choices behind the number (whether you use mean or median, how it's weighted, and which clients count) can shift it by several percentage points. Public Form 5500 filings can't fill that gap. Why is that so? Because they're filed by plan rather than by carrier. There's also no field for renewals and there's no data at the client level. Filings lag by up to 9½ months and clients who left are not in there. Twenty years of filings show cost trends but not renewals. And they can't prove or disprove that PEO health insurance pricing reverts to the market average. We propose the Benefitra PEO Renewal Transparency Index. Each PEO is given the same set of written questions. Their answers are published word for word alongside their public filings and they get a disclosure level from 0 to 4. That level is about disclosure rather than price. The headline figure counts every client offered a renewal at the rate it was offered and this includes the ones who left.
Want the plain English version? Check out the article Do Some PEOs Stay Cheap on Health Renewals, or Does Everyone Revert to the Mean? [27] It goes through the same evidence for employers and brokers and also has a published client quote comparison.
Key findings
- There is no standard method for a PEO “average renewal.” We looked for a federal, state or industry rule that defines one but did not find any. General rules against misleading statements still stand, though. Inference
- Form 5500 is filed by each plan rather than by each carrier. Justworks groups its Aetna, UnitedHealthcare and Kaiser contracts into one filing but G&A Partners files 14 separate medical plans. Direct
- You won't see a renewal increase on Form 5500. There is no renewal field and there is no client level data either. Schedule A has no self funded (ASO) premium, head counts don't match up and filings lag by up to 9½ months. Direct
- It doesn't show the clients a PEO loses either and those departures are big. Insperity reported that client retention was about 83% in 2025. TriNet reported that a 10% drop in its worksite employees was partly due to repricing of health benefits, though mainly due to declines in three client verticals. Direct
- Twenty years of filings show trends in healthcare costs rather than renewals. Only Insperity has a clean 20 year series. From 2006 it tracked the national trend but over 10 and 15 years it ran below it. ADP TotalSource ran 1.6 to 3.4 points lower each year, depending on the start year, and a lot of that gap still hasn't been explained. Can public data prove or disprove mean reversion? No, it can't. Benefitra analysis
- The proposed gold standard uses one cohort. That's every client with 12+ months at renewal that got a renewal offer, counted at the rate it was offered, and clients who left still count. The headline is book level like for like. Churn, buying down and averaging choices can't move it. Benefitra proposal
- Each PEO gets a disclosure level, not a price grade. It ranges from Level 0 (declined or no response) up to Level 4 (independently attested). The reported numbers are in a separate panel and Appendix A contains the rules. Benefitra proposal
What this paper does
- Uses actual filings to show what Form 5500 can and can't reveal about PEO health insurance renewals
- Summarizes Benefitra's Form 5500 analysis from 1999 to 2025, weak points included
- Proposes a neutral and voluntary way of disclosure, with the rules in Appendix A
What it does not do
- Rank PEOs according to price or say that any PEO is cheaper
- Accuse any PEO of misreporting
- Give a quote, or legal, tax or actuarial advice
- Use private data from any client
Here's how to read the labels. Direct means a source we opened states it. Interpretation is our own reading of what a source actually means. Inference is our own conclusion, drawn from several facts or from data we have. Benefitra analysis marks a result from Benefitra's own calculations on public data, not yet published in full. And PROPOSAL marks a rule that is not final yet, pending counsel and a decision from Sam Newland.
Contents
- An “average renewal” has no standard definition
- Do PEOs file Form 5500? Per plan, not per carrier
- Why Form 5500 cannot tell you the renewal increase
- Does Form 5500 control for clients a PEO loses?
- What 20 years of filings show, and what they can't
- What the Index method aims to do
- Methods and data
- Limitations
- Next steps
- Disclosures, license, citation and changelog
- References
- Appendix A. How the Index rates a PEO (Scorecard Standards)
Terms. A PEO (professional employer organization) is a company that coemploys a small business's workers and handles payroll, human resources and often health benefits. WSE stands for worksite employee, meaning a client's employee whom the PEO coemploys. A renewal increase is the percentage change in what a client pays for health coverage when its contract renews. Form 5500 is the annual report most ERISA benefit plans file with the U.S. Department of Labor (DOL) through EFAST2. Schedule A is the Form 5500 attachment for each insurance contract, and it lists the carrier, persons covered, premiums and broker pay. MEWA means multiple employer welfare arrangement, and Form M-1 is its annual DOL report. ASO is administrative services only, where the plan pays its own claims (self funding). EIN / PN are the employer identification number and plan number, which together identify one plan. A wrap plan is one plan document that wraps several insurance policies. A 10-K is a public company's annual SEC report. ESAC is the Employer Services Assurance Corporation, a voluntary PEO accreditation body. And NHE refers to the CMS National Health Expenditure accounts.
1 An “average renewal” has no standard definition
1.1 What PEOs publish
Some PEOs do release renewal statistics and one we opened is Rippling's 2026 PEO Trust and Transparency Report [15]. It states that “84% will see a medical rate increase at or below our 9% base renewal, averaging just 6.5% across all benefits carriers,” and also that “another 5% will land under 17%,” and that “only 11% will see an increase higher than that.” A footnote explains that “the 6.5% average increase reflects renewal outcomes for the cohort ... who received an increase at or below our 9% base rate,” for customers “who've joined the PEO on or after 12/31/2024.” Direct
Rippling reveals those definitions and that's the kind of disclosure this paper argues for. But the example also shows why definitions matter. The 6.5% figure is based only on the 84% at or below the base rate and doesn't reflect every renewing customer. Using just the bands that Rippling published, the average for all renewing customers has to be at least about 7.8% (0.84 × 6.5% + 0.05 × 9% + 0.11 × 17%, using the lowest possible value in each upper band). The real number might be higher. Why? The report does not specify how far over 17% the top 11% went. There are also two caveats. The bands talk about medical rate increases but the 6.5% is averaged “across all benefits carriers”. And a group joining on or after December 31, 2024 will include clients who have under 12 months of tenure at the 12/1/2026 renewal. Inference (our arithmetic) Rippling does not claim that 6.5% is the average for all customers.
1.2 The choices behind any “average”
| Choice | Options | Why it matters Inference |
|---|---|---|
| Statistic | Mean, median, trimmed mean | A few very large increases raise the mean but not the median. |
| Weighting | Per client, per enrolled employee, per premium dollar | Small clients often see more volatile renewals. Weighting by client counts them as much as large clients. |
| Who is counted | All clients offered a renewal. Clients who accepted. Clients still active later | Clients who left after a large increase drop out of an “accepted” average. |
| Tenure | All clients, or only clients with 12+ months | A client that joined two months before renewal may get a small first adjustment. |
| Before or after plan changes | Rate change on the same plan, or change in cost after a buy down | A buy down lowers the cost change without lowering the rate. |
| Scope | Medical only, or medical plus dental, vision and fees | Mixing lines dilutes medical trend. |
| Period | Calendar year, plan year, rolling 12 months | Different start dates capture different trend periods. |
1.3 What rules exist, and what they do not cover
- Federal ERISA reporting. Neither Form 5500 nor Form M-1 has a field for a renewal increase or a rate method [1][2]. Inference
- IRS certification of PEOs. Rules for certified PEOs cover financial and employment tax requirements. Benefit pricing is not addressed in them (prior Benefitra review of 26 CFR 301.7705 to 2 [20]. Not reopened for this draft).
- State PEO laws. We looked at the PEO statutes in Texas and Florida. They require certain benefit disclosures but do not specify a method for a renewal average [20]. We did not survey all 50 states.
- Industry accreditation. Here's what ESAC's standards say. “information provided to Clients and prospective Clients by Accredited PEOs shall not contain incorrect or misleading information,” and “PEO participation in ESAC programs is voluntary” [14]. Direct What they don't do is define how a renewal average should be computed. Inference
- Securities law for public PEOs. A public PEO has to discuss known trends and uncertainties as part of the management discussion in its 10-K (Regulation S-K Item 303 [13]). Direct Each company chooses its own metric for health insurance costs. Insperity reports cost “per covered employee” [11] and TriNet uses an “insurance cost ratio” [12]. Neither of these is a distribution of client renewals. Inference
- General consumer protection law. State laws that forbid unfair or deceptive practices deal with misleading statements in general. Interpretation We haven't reviewed specific statutes though.
Inference PEO renewal marketing does fall under general rules against misleading statements. But we haven't found any rule that tells a PEO how to calculate or disclose an “average renewal.” Having a standard and voluntary way of disclosure would fill that gap.
2 Do PEOs file Form 5500? Per plan, not per carrier
2.1 Yes, for their sponsored health plans
- Direct According to the DOL's MEWA guide, “a PEO plan or arrangement that offers or provides health coverage to employees of two or more client employers ... is a MEWA,” and being a coemployer under other laws does not resolve the question for a PEO [6].
- Direct Plans that need to file Form M-1 “are required to file the Form 5500 regardless of the plan size or type of funding” [1]. The small plan exemption in 29 CFR 2520.104-20 does not apply to them [4]. Form M-1 is due on March 1 each year [5].
- Direct Form 5500 filings use EFAST2 and those are publicly available [1]. The DOL also releases bulk data for each form year [7].
- Direct (data) In their 2024 filings, Insperity, CoAdvantage and Paychex Business Solutions said “yes” to whether they were subject to Form M-1. ADP TotalSource, Justworks and TriNet said “no” [7]. In its 10-K, Insperity calls its plan “a single employer plan” [11]. Inference That Form M-1 answer is the sponsor's own legal view rather than a DOL finding. A “no” shouldn't be read as wrongdoing.
2.2 The rule. One Form 5500 per plan, one Schedule A per contract
Say a PEO uses three different insurance carriers like UnitedHealthcare, Aetna and Cigna. Does that mean it files three Form 5500s? Not because of the carriers, no. The rules tie filings to plans.
- For each plan there is one filing. “One Form 5500 is generally filed for each plan or entity” [1].
- For each insurance contract there is one Schedule A. “Provide information for each contract on a separate Schedule A. Individual contracts grouped as a unit in Parts II and III can be reported on a single Schedule A” [2].
- Self funded administration gets no Schedule A at all. “Do not file Schedule A for a contract that is an Administrative Services Only (ASO) contract” [1].
- Separate policies do not mean separate plans. “The fact that you have separate insurance policies for each different welfare benefit does not necessarily mean that you have separate plans”. Sponsors can use a “wrap” document, and to figure it out “you must review the governing documents and actual operations” [1].
- Each plan gets its own number and for welfare plans this numbering starts with 501 [1].
Interpretation Take a PEO that has three carriers under one wrap plan. It files one Form 5500 which has at least three Schedule As attached, and often many more, because each regional carrier entity or policy is usually a separate contract. It files three Form 5500s only if there are three plans set up or if different legal entities sponsor different plans.
2.3 What real PEO filings show
We checked bulk EFAST2 data from the DOL for form year 2024 (plan years starting in 2024). We downloaded this data on August 25, 2026 [7]. The counts refer to the Schedule As that go with each filing and, among those, the contracts flagged as medical (health, HMO, PPO or indemnity). For insurance carriers we counted distinct carrier legal names as they were filed.
| PEO (sponsor EIN) | Welfare plans filed (plan number. What it covers) | Main medical plan. Schedule As (medical) | Carriers on the main medical plan |
|---|---|---|---|
| Justworks (46-2283648) | 501. All health and welfare benefits in one plan | 13 (10) | Aetna (2 legal entities), UnitedHealthcare, Kaiser (7 contracts across 5 regional entities) |
| ADP TotalSource (59-3216484) | 501. All health and welfare benefits | 39 (34) | 34 legal entities, including Aetna, Anthem, several Blue Cross plans, Kaiser regions, UnitedHealthcare, Harvard Pilgrim, Regence, Medica |
| Insperity (76-0178498) | 502. Health, dental, vision. 504. Life and disability. 505. Health FSA | 25 (24) on plan 502. Plan 504 has 8, none medical | UnitedHealthcare, Harvard Pilgrim/HPHC entities, Kaiser regions, Blue Shield of California, BCBS of Hawaii |
| CoAdvantage (59-3434670) | 501. Health and welfare. 502. Health FSA | 15 (12) | Kaiser regions, Aetna, BCBS of Florida, Health Options, BCBS of Alabama, others |
| Paychex Business Solutions (59-2693969) | 501. Health and welfare. 502. FSA | 26 (13) | Aetna entities, Kaiser regions, BCBS of Texas and Florida, Tufts, others |
| TriNet (several EINs) | HR III (48-1304650) 501. Health and welfare. 502. Section 125/129/FSA. 503 and 504. Health, no Schedule A. Also HR II, HR IV, HR I, HR XI, each with its own EIN and plan 501 | HR III 501. 100 (88). HR IV 501. 20 (8). HR II 501. 4 (0) | HR III. Aetna, Cigna, UnitedHealthcare, Kaiser regions, several Blue plans, Harvard Pilgrim. HR IV. Kaiser, UnitedHealthcare |
| G&A Partners (76-0461926) | 14 separate medical plans (504, 506 to 508, 510 to 518, 520), plus 503 (nonmedical welfare), 519 and 521 (dental), 501 (cafeteria) | Plan 504. 1 (1) | Mostly one carrier per plan. 504 BCBS of Texas. 506 and 515 Cigna. 507 BCBS of Minnesota. 508 BCBS of Illinois. 511 Blue Cross of California. 520 UnitedHealthcare. Three Kaiser plans. Others |
- Per plan rather than per carrier. Direct Justworks files three carrier families in a single filing. ADP includes 34 carrier entities in one.
- Splitting by benefit type. Direct Insperity puts medical, dental and vision in plan 502, and life and disability in plan 504. If you're comparing “plan participants” across PEOs you have to know what benefits each plan actually covers.
- Splitting by legal entity. Direct TriNet uses coemployment through several subsidiaries and each subsidiary files its own plans. You need all of them to get a full picture of TriNet. TriNet HR III plans 503 and 504 report medical benefits paid out of general assets, and there is no Schedule A. Why? We have not identified that yet. Inference
- Splitting by carrier or region. Direct Most of the 14 medical plans of G&A Partners use just one carrier. This is G&A's plan design and not a filing rule. Interpretation
- Cafeteria and FSA plans are separate filings, and they carry no premium data. Direct TriNet, G&A, Vensure, CoAdvantage, Insperity and Paychex each file a separate Section 125 or FSA plan. The IRS suspended the old Schedule F requirement in Notice 2002 to 24 [10]. Inference With no insurance premiums in them, these should be left out of any premium analysis.
Inference Here is a practical guideline for analysts. Find every EIN used by the PEO group and list every welfare plan number under each one. Keep the plans that have medical coverage and then sum up their medical Schedule As. Counting filings would be wrong for most PEOs listed in Table 1, and assuming one filing per carrier would be wrong for them too.
3 Why Form 5500 cannot tell you the renewal increase
Form 5500 provides useful context. But it isn't a renewal measure.
- There's no field for renewals and no client level data either. What Schedule A reports instead are plan level premiums, claims for experience rated contracts, the number of persons covered and payments to brokers [2]. There is nothing on it that says what any one client was charged or how rates for that client moved. Inference
- Mix and survivorship. When the client mix shifts, so does a plan's average cost. Inference And turnover is big enough to matter. Insperity reported client retention of about 83% in 2025 and 81% in 2024, and it lists “client nonrenewal due to price or service factors” as one of the causes of attrition [11]. TriNet said total worksite employees fell 10% in 2025, “primarily due to declines in our Technology, Professional Services, and Main Street verticals” and “partially attributable to necessary repricing of our health benefits services”. Average worksite employees dropped 5% [12]. Direct We go through this in Section 4.
- Plan buy downs. Say clients move to plans with higher deductibles. Then premiums per person can go up less than the rates did, and Form 5500 does not report changes in plan design. Inference
- There are self funded and partially self funded portions. ASO contracts do not appear on Schedule A [1]. Insperity says it accounts for its UnitedHealthcare contract “using a partially self funded insurance accounting model” [11]. And according to TriNet, under its insurance policies “we bear claims costs up to a defined deductible amount” [12]. Direct The Schedule A “premium” may not match the economic cost. And it isn't what clients actually paid to the PEO. Inference
- Headcounts that don't match up. Form 5500 counts participants, and “covered dependents are not counted as participants” [1]. Schedule A though gives the “approximate number of persons covered” for each contract, which is a number the administrator “should estimate” [1][2]. Direct Examples Inference from 7. For the 2024 plan year, ADP's medical contracts report about 1.73 million persons covered compared to about 531,000 active participants. That's a ratio of about 3.3. For plan year 2024, TriNet HR III's medical Schedule A premium went down 56% (from about $1,249 million to about $549 million), while the number of persons covered dropped about 12%. Why? We haven't identified the reason. And for Justworks in plan year 2021, premium per covered person went up 19% while premium per active participant went up 57%, because the two headcounts moved in opposite directions.
- Lag. A filing has to be in by “the last day of the 7th calendar month after the end of the plan” year, and extensions can't go beyond “a total of 9½ months beyond the close of the plan year” [1]. The filing for Insperity's plan year 2024 was received on October 14, 2025. CoAdvantage's plan year starting in October 2024 was received on July 15, 2026 [7]. Direct PEOs are quoting 2027 renewals, while for most PEO plans the most recent complete public year is still plan year 2024. With an extension, plans for calendar year 2025 must be filed by October 15, 2026, so Insperity's plan year 2025 filing may appear soon after this preview.
- Plan year versus calendar year. Plan years start at different times. Insperity's starts in January, ADP's in June, CoAdvantage's and TriNet HR III's in October, and Justworks' in November [7]. A year over year change covers different calendar periods from one PEO to the next, and the CMS NHE benchmark runs on the calendar year.
- What “premium” includes. Schedule A separates experience rated contracts from the ones that aren't experience rated, and it lists broker commissions separately [2]. You won't see the PEO's own markup or service fee there. Choose a different premium definition and you get a different answer. Inference
- Multiple plans, entities and acquisitions. After an acquisition or consolidation, enrollment can be moved from one filing to another. And several of the “latest” filings in the data are actually amendments, filed one to three years after the original [7].
3.1 Units used in this paper
| Unit | Source | Counts |
|---|---|---|
| Per covered person | Form 5500 Schedule A “persons covered” | Estimated by the carrier or administrator. May include dependents. Year end count |
| Per participant | Form 5500 line 6a(2), active participants at year end | Roughly enrolled employees. A wrap plan counts across all its benefits |
| Per worksite employee (WSE) | 10-K average worksite employees | All coemployed workers, enrolled or not. Definitions change (TriNet from 2024 includes COBRA and platform users) |
| Per covered employee | Insperity 10-K | Employees enrolled in health coverage. Includes Insperity's own claims costs |
3.2 An illustration. Three series
There are three series that hold up well enough in Form 5500 to show a cost trend. Those are Insperity and CoAdvantage from plan year 2019 and Justworks from plan year 2021. Justworks' 2019 to 2021 values fail the data quality rules so we flag them. ADP, TriNet and Paychex? They have the headcount or completeness issues described above.
| Plan year start | Insperity (Jan) | Change | Justworks (Nov) | Change | CoAdvantage (Oct) | Change |
|---|---|---|---|---|---|---|
| 2019 | $5,402 | $7,093 flagged | $6,946 | |||
| 2020 | $5,504 | +1.9% | $5,716 flagged | −19.4% flagged | $7,123 | +2.5% |
| 2021 | $5,703 | +3.6% | $6,807 | +19.1% flagged | $7,337 | +3.0% |
| 2022 | $6,106 | +7.1% | $7,718 | +13.4% | $7,849 | +7.0% |
| 2023 | $6,663 | +9.1% | $7,562 | −2.0% | $7,338 | −6.5% |
| 2024 | $6,999 | +5.0% | $7,953 | +5.2% | $7,536 | +2.7% |
| Annual growth | 5.3%/yr (2019 to 24) | 5.3%/yr (2021 to 24, clean run only) | 1.6%/yr (2019 to 24) |
How we computed it. We take experience rated earned premium and add non experience rated total charges on Schedule A contracts flagged health, HMO, PPO or indemnity, then divide by the total persons covered on those same contracts. One flag. In plan year 2020 Justworks persons covered went up 65%. That breaks the headcount and premium jump rules in Appendix A (rule D3), so its 2019 to 2021 changes are not price changes.
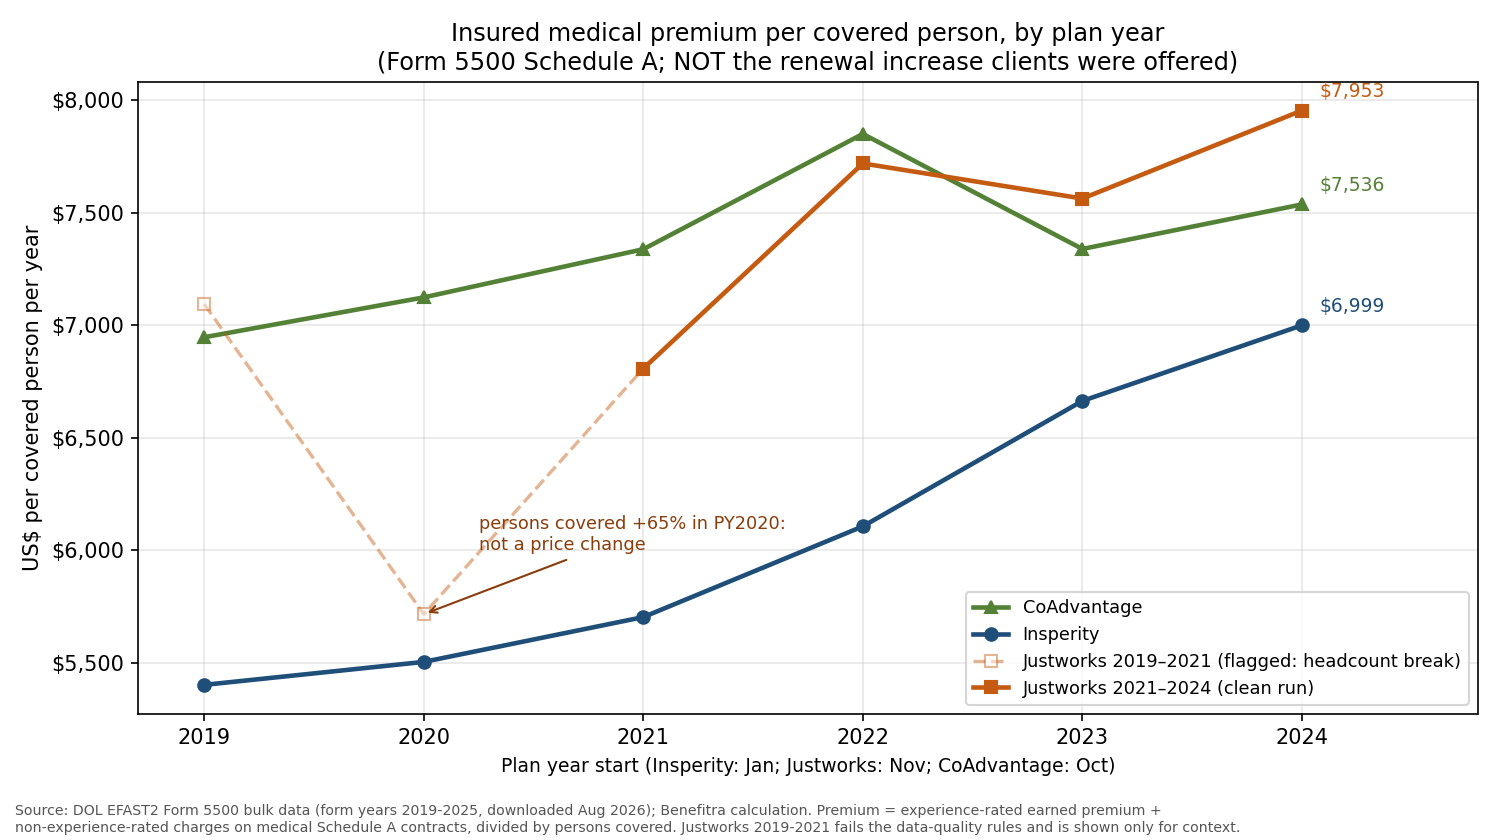
Inference How should we read this? CoAdvantage's 6.5% drop in 2023 could be due to mix, buy downs or changes in counting, and we can't tell from the filing which one it is. Insperity's 5.0% for plan year 2024 is close to the 4.3% rise in “cost per covered employee” reported in its 10-K for 2024 [11]. But they are different measures. The 10-K number is per covered employee and it includes claim costs that Insperity itself bears under its partially self funded arrangement. For 2025, Insperity's 10-K reports an increase of 9.2% in cost per covered employee, along with “higher average pricing of 3%” in revenue per worksite employee [11] Direct. The 10-K report is newer, and the Form 5500 has more detail. Neither one shows how client renewals are distributed.
4 Does Form 5500 control for clients a PEO loses?
No. Form 5500 is a snapshot of the whole plan. For PEO plans there is no detail at the client level and no place for groups that have left. So it can't account for attrition among clients and it can't show which clients left or why. Inference from 1, 2, 21, 22
4.1 What the form actually records
| Item | What it reports | What it does not report |
|---|---|---|
| Form 5500, line 5 | “Total number of participants at the beginning of the plan year” 21 | Who they are, or which employer they work for |
| Lines 6a(1) and 6a(2) | “Total number of active participants” at the beginning and end of the plan year. “Welfare plans complete only lines 5, 6a(1), 6a(2), 6b, 6c, and 6d” 21, 1 | Joiners and leavers separately. Only the net result |
| Line 7 | Employers obligated to contribute. “only multiemployer plans complete this item” 21 | A client count for a PEO plan (blank for PEO plans. Inference) |
| Schedule A | Per contract. “approximate number of persons covered at end of policy or contract year,” premiums, and (experience rated) claims and retention charges 2, 1 | Persons covered earlier in the year. Per client premiums. Rates offered or accepted |
| Schedule H (large plans with assets) | Plan wide totals such as contributions and benefit payments “to insurance carriers for the provision of benefits” 22 | Any breakdown by client employer |
| Multiple employer welfare plan attachment | A “Participating Employer Information” list with each employer's name and EIN 1 | Renewal rates, departure dates or reasons. Not in the bulk data. Single employer PEO filers (such as Insperity, ADP TotalSource, Justworks and TriNet) do not file it (inference from 1, 7) |
4.2 Why this matters. Survivorship
Inference When a PEO reprices at renewal, the clients hit with the biggest increases are the ones most likely to shop around or leave. They may also be the groups with higher claims. What's left in a plan level filing is then mostly the clients who stayed, and that has two effects.
- Survivors can look cheaper. Say higher cost groups drop out. Next year's premium per covered person is then calculated on a lower cost pool, so the trend in Table 2 can rise less than the increases clients were offered.
- Timing adds noise and it can work either way. Schedule A premium covers the whole contract year, but people covered are counted at the end of it [1]. A group that leaves part way through the year adds premium but no year end persons. Groups that join midyear do the opposite.
You can't measure or remove either effect based only on Form 5500 data.
4.3 Indirect proxies and their limits
- Participant numbers at the beginning and end of the year. They show only the net change. If you lose 20% of participants and gain 20%, the plan shows no change.
- Year over year growth in headcount. Same issue, it's only net. It also mixes hiring and layoffs inside clients who stayed with whole clients joining or leaving.
- Lists of participating employers (multiple employer filers only). You could tally employers that joined or left from these, but only by reading the PDF of each filing, and they give no rates and no reasons.
- 10-K disclosures (public PEOs only). These report client retention or WSE counts across the whole company. Nothing at the plan or cohort level.
Inference from 7 Direct from 11 Here's an example of the gap. Insperity's Group Health Plan had 207,449 active participants at the end of plan year 2023 and 202,013 at the end of plan year 2024. That's a net drop of around 2.6%. Yet in its 10-K for 2024, Insperity put client retention at about 81%. So roughly one client in five left. Clients and participants are not the same unit, so we can't reconcile the figures exactly. But they do show how much gross turnover can hide behind a small net change.
4.4 Evidence that exits are material
- Direct Insperity. Client retention was about 83% in 2025 and 81% in 2024, and its 10-K names “client nonrenewal due to price or service factors” as one of the causes of client attrition [11].
- Direct TriNet. Total worksite employees fell by 10% in 2025, “primarily due to declines in our Technology, Professional Services, and Main Street verticals” and “partially attributable to necessary repricing of our health benefits services” [12]. For TriNet HR III's main plan (plan year starting October 2024) there were 245,531 participants at the beginning of the year and 220,810 active participants by the end [7]. Because that filing's medical premium moved very differently from its headcount (Section 3), we don't compute a premium per person trend from it.
Inference Exits are large enough to move a plan level average. That is why the gold standard in Section 6 keeps lost clients in the cohort at the rate they were offered. And it puts retention and the actual premium change right next to the headline.
5 What 20 years of filings show, and what they can't
Benefitra's companion analysis [23] goes back as far as the public data allow. It read every Form 5500 main filing for filing years 1999 through 2025, plus Schedule A and, if one was filed, Schedule H. The search looked at 33 named PEOs (17 on Benefitra's initial list plus 16 from the ESAC accredited directory), checking name variants and EINs. The companion report also calls this “about 45 PEO groups”. We haven't yet reconciled those two counts, and the full search list will be published along with the data. The analysis looked at two things. Do PEO health insurance premiums go up and down in a pattern? And how much of a long term trend could come from churn, client mix or self funding rather than price?
Three caveats first. All figures are insured premium per covered person or per participant as reported on Form 5500. None of them is a renewal increase. Most tests use 5 to 22 yearly observations for each PEO, so take the p values as just indicative, and a real effect of 1 percentage point a year would often go undetected. And the sample itself is survivor biased. Only PEOs that keep filing clean data make it into the long windows. All of this is Benefitra analysis of public data, and the analysis isn't fully published yet.
5.1 Which PEOs have 10, 15 or 20 clean years
A clean run means plan years in a row with no break. What counts as a break varies by metric. For per covered person, it's a missing year, persons covered ÷ participants shifting more than 30%, or premium per person jumping more than 30%. For per participant, it's a missing year, a jump of more than 30%, or participant numbers stuck at the 32,767 legacy field cap. The per participant rule has no headcount ratio test, so a per participant run can contain headcount restatements (see ADP below). How long is long enough? For a 10 year window you need at least 11 clean yearly levels, 15 years need 16, and 20 years need 21.
| Window | Qualifying series | Data flags |
|---|---|---|
| 20 years | Insperity (per participant only) | None |
| 15 years | Insperity (per person and per participant). ADP TotalSource (per participant) | ADP. Beginning of year participants differ from the prior year end count by 18.5% (2006), 21.6% (2009) and 40.8% (2012). PY2012 participants +42% and premium per participant −18.5% |
| 10 years | Insperity. ADP TotalSource. G&A Partners plan 504 (per participant). AdvanStaff HR (per person and per participant) | G&A plan 504 is only part of G&A's book. AdvanStaff premium level is low (about $2.3k, $4.9k per person), so it may not be comparable with the others |
Not one per person series reaches 20 years. AdvanStaff HR (ProService group) qualifies per person only for 2009 to 2020, at 6.2% a year, and per participant for 2011 to 2024. Most large PEOs do file a health plan under their own EIN, but their series fall short for other reasons.
| PEO | Clean run | Data flag |
|---|---|---|
| Prestige | 4 / 9 | Persons per participant ratio shifts more than 30% in 2009, 2013, 2014, 2022 and 2023. A premium break in 2022. Sponsor EIN changes from 2022 |
| FrankCrum | 3 / 9 | Persons per participant ranges from 2.0 to 4.8. Small plan |
| AlphaStaff | 3 / 5 | Participant counts change by large amounts (for example 51.7k to 8.2k) |
| Paychex Business Solutions | 4 / 6 | 2015 missing. Persons covered about equal to participants (flagged). Premium breaks |
| Oasis (Paychex from Dec 2018) | 4 / 4 | Participant counts at the 32,767 field cap in 2016 to 18. Acquired plans filed separately |
| CoAdvantage | 7 / 8 | Persons covered about equal to participants in 2013 to 16 and 2018 to 24 (flagged). Books from acquired PEOs |
| Vensure | 3 / 4 | 9 filed years to 2024, 3 to 4 clean. Acquired brands rolled into Vensure plans |
| Engage | 3 / 3 | Short. New plan numbers for acquired PEOs in 2023 to 24 |
| Questco | 3 / 4 | 9 filed years |
| SouthEast PEO | 4 / 4 | Plan number switch with a level shift. 2023 missing. About 1.4k, 2.9k participants |
| Tilson | 6 / 7 | About 70% to 87% of benefits paid directly, so Schedule A premium misses most of the cost. 2022 missing |
| TriNet (main plan) | 5 / 9 | Many parallel plans. Most benefits classified as paid directly from 2020 (Section 5.5) |
| Decision HR | none | One 2011 filing with 171 participants. No PEO wide health plan found under the names and EINs searched |
There are some other patterns too. Some plans are very small (Emplicity, Employer Solutions Group, AmCheck). Under the names and EINs we searched, the only plans found for Asure were for Asure's own employees, and no PEO sponsored health plan came up for Key HR or Lone Star PEO. A PEO may offer coverage through plans sponsored by insurance carriers or clients, and those plans never show up under the PEO's own EIN. So “not found” does not mean a PEO offers no health coverage. Because there is no bulk dataset for Form M-1, MEWA reports couldn't be used.
5.2 No detectable high low pattern, and why that doesn't settle mean reversion
People often wonder if a PEO that had a bad year is “due” for a good one. The pooled filings don't show that.
- Over 10 series and 76 yearly changes pooled together, the correlation between one year's change in premium per person and the next is −0.23 (lag 1 autocorrelation). But short samples alone would give about −0.15, and a permutation test yields p = 0.35.
- Over 1 to 5 years, the spread of growth rates across PEOs shrinks about as fast as simple averaging would predict (standard deviation 10.6, 6.0 and 4.7 points at 1, 3 and 5 years, compared to 10.6, 6.1 and 4.7 predicted). It narrows faster at 7 and 10 years (3.1 and 2.8 versus 4.0 and 3.4). However only about two PEOs get to those windows.
- Two single PEO tests do show reversion type results. AdvanStaff HR's regression slope for 3 years ahead is −0.56 (p = 0.004), but it relies on just 5 nonoverlapping observations. In the first version of the analysis, the per participant series for ADP TotalSource shows a slope of about −0.41 (p < 0.01). This is fragile, because it's driven largely by the 2012 headcount jump.
- One off counting errors also give a mild negative tilt. A headcount error makes one year look higher and the next year look lower. Interpretation
Inference Public filings can't prove or disprove mean reversion in PEO health insurance renewals. Why not? Premium per participant moves with churn, buy downs and mix, so “no detectable pattern” in the filings doesn't tell you much about how a particular client's renewals behave. Only offered renewals for each client could settle it, and that includes the clients who left. The companion article goes through this for employers.
5.3 Insperity. Close to the national trend from 2006, below it over 10 and 15 years
Insperity has the best long series. But what it shows depends on which window you pick.
| Window (ending 2024) | Insperity, %/yr | NHE, %/yr | Gap, points |
|---|---|---|---|
| 2006 to 2024, per covered person | 4.4 | 4.3 | +0.1 |
| 2004 to 2024, per participant | 4.4 | 4.5 | −0.1 |
| 15 years (2009 to 2024), per covered person | 3.4 | 4.0 | −0.6 |
| 10 years (2014 to 2024), per covered person | 3.6 | 4.9 | −1.3 |
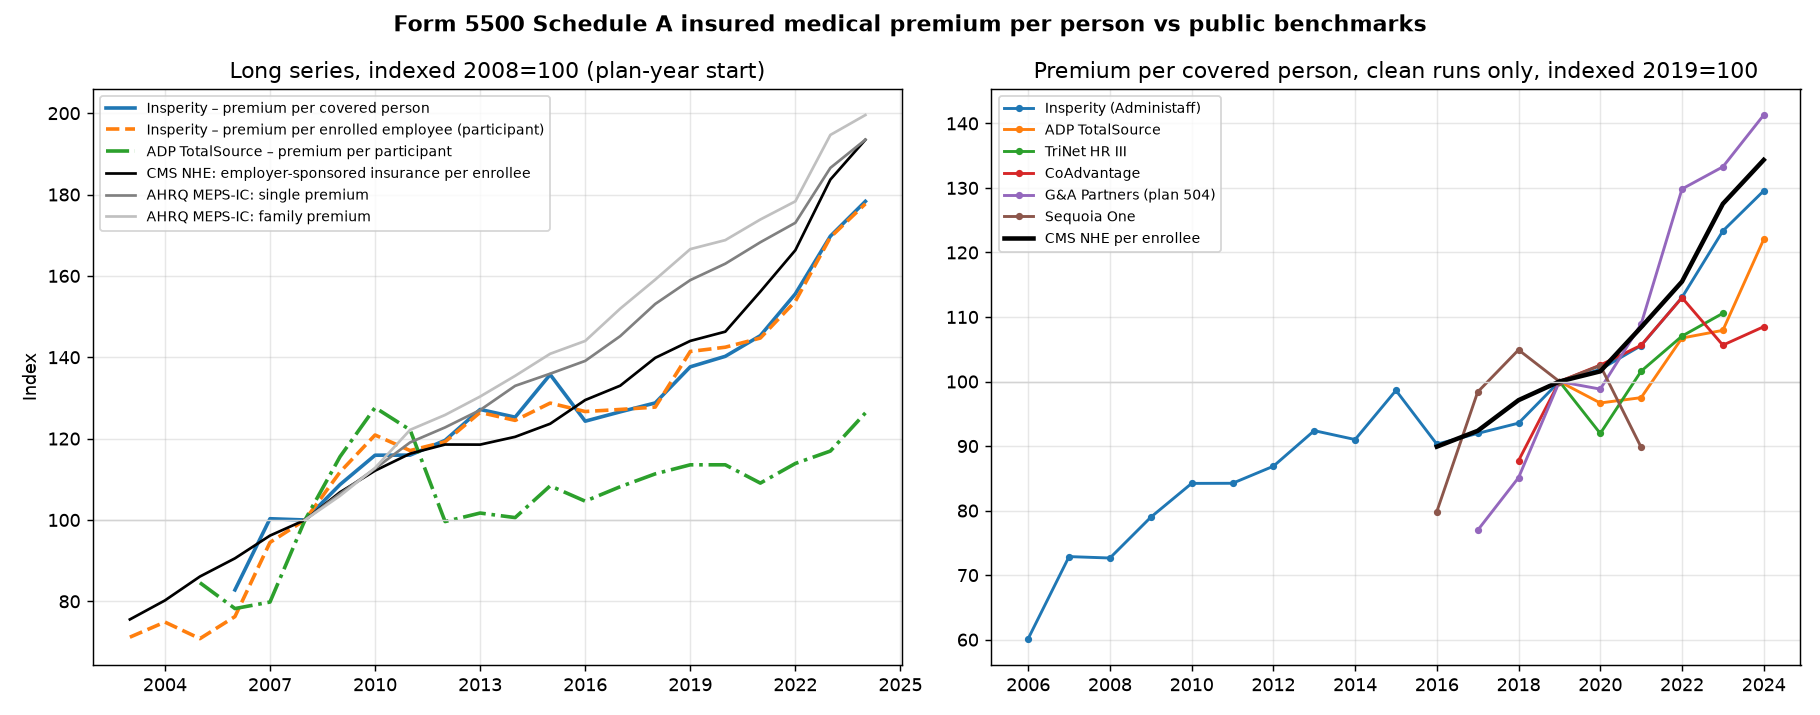
Benefitra analysis The things the filings can measure account for well under 1 percentage point a year of Insperity's trend.
- Mix. More dependents per covered employee (1.97 to 2.13) add about 0.4 points a year to growth per participant. They add none to growth per person.
- Timing of headcounts. This comes to about zero.
- Carrier margin. Claims outgrew premium by about 0.2 points a year.
- Changes in carriers and acquisitions. There's no detectable effect, and Insperity did not acquire any PEO client books.
- Coverage selection. The share of worksite employees enrolled dropped from 72.7% to 64.0%, and we're not sure which way that pushes the trend.
From 2006 to 2024, Insperity's 10-K cost per covered employee rose 4.0% a year, compared to 4.8% per participant in the Form 5500 data. Yearly changes in the two sources correlate at r = 0.52 (p = 0.02). Client retention rates at Insperity ranged from 71% to 86%. And years that saw a bigger 10-K cost increase were followed by lower client retention the following year (R = −0.42, p = 0.05, borderline. Spearman −0.54, p = 0.009. N = 22). Note this is one of several low power tests, and no correction has been made for multiple comparisons. It fits with clients leaving after big increases. But we can't measure from filings how much that moves the premium trend. Inference
5.4 ADP TotalSource. A gap the filings only partly explain
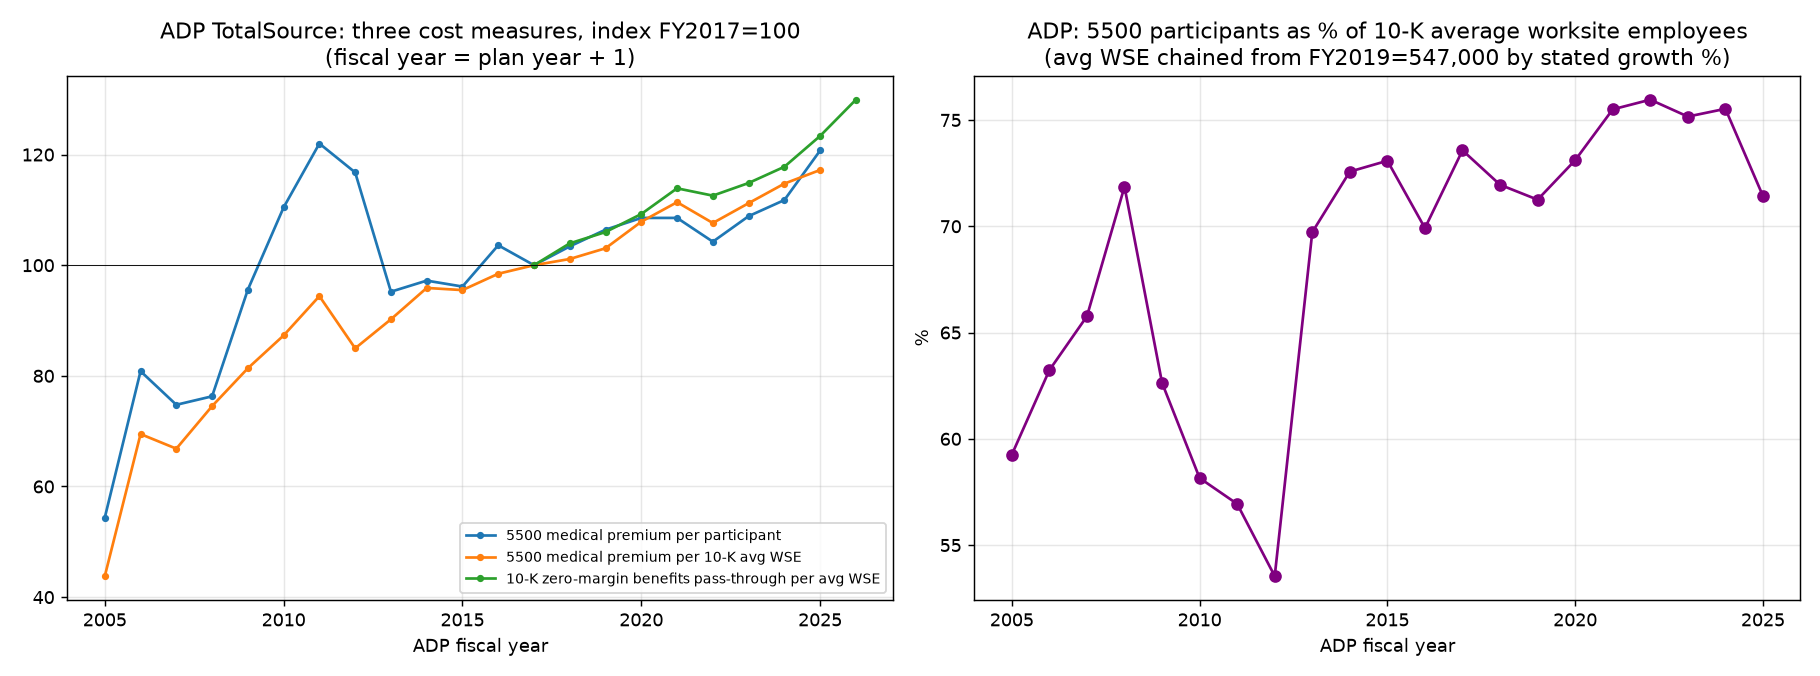
From plan years 2005 to 2024, premium per participant for ADP TotalSource rose about 2.1% a year. NHE rose about 4.4%, leaving a gap of about 2.3 points a year. Change the starting year, though, and the results vary quite a bit. It's 2.7% a year for 2006 to 2024 (gap about 1.6 points), 2.3% for 2014 to 2024 (gap about 2.6) and 0.6% for 2009 to 2024 (gap about 3.4). ADP's plan year runs from June to May, so plan year t falls mostly in ADP fiscal year t+1. We haven't aligned NHE (calendar year) for this. Over 19 years this doesn't matter much. Benefitra analysis
- Participant counting accounts for about 1 point a year. Form 5500 participants rose from about 59% to about 75% of average worksite employees in the 10-K. Premium per 10-K worksite employee rose 2.8% a year over fiscal 2006 to 2024, compared to 1.8% per participant over those same fiscal years. Most of that increase in the enrollment share came in one jump, from fiscal 2012 to 2013 (plan year 2012. Participants +42%). Then in fiscal 2025 the share dropped back to about 71%. Was it a change in who gets counted, or actual growth in enrollment? The filings can't tell us.
- The remaining 1.3 to 1.5 points a year are unexplained. Treat this as approximate, since it mixes the plan year 2005 to 2024 gap with the fiscal 2006 to 2024 headcount effect. Some possible reasons include plan buy downs, a younger or healthier client base, carrier contracting and churn driven selection. None of these can be measured without ADP level data.
- Self funding and timing explain about nothing here. Benefits paid directly dropped from 3.2% to 1.3% of the plan's benefits.
- ADP's own accounting also tells a similar story. Its 10-K “zero margin benefits pass through” per average worksite employee rose 2.7% a year from fiscal 2017 to 2025. So the low trend is not just an artifact of Form 5500. But that measure is per worksite employee too, so it also depends on the enrollment share. We haven't rechecked this figure against each 10-K.
- Client retention. ADP doesn't publish an annual PEO client retention rate. Its fiscal 2025 and 2026 10-Ks estimate PEO client retention at “approximately 6 years,” down from “approximately 7 years” in fiscal 2016 and 2021 [25][26] Direct . Six years comes to roughly one client in six leaving each year (our arithmetic), which is about the same as Insperity's attrition. For ADP, though, churn can't be tested year by year.
Benefitra client case (published) The article's ADP section adds one published side by side quote. It's for an 11 employee Boston law firm. There, a Prestige PEO quote with a Cigna PPO came in 29.7% below ADP TotalSource's comparable HMO quote for year one [28]. That's one group and one quoting cycle. It isn't evidence about ADP's book, and Benefitra was the broker on the case. The article has the details.
5.5 TriNet, Paychex and the pooled data
- TriNet. From plan year 2020 on, Schedule H classifies 80% to 82% of the main plan's benefits as paid directly. This may be at least partly due to an accounting reclassification. Either way, TriNet's Schedule A premium understates its total cost, and its premium only series can't be compared to Insperity's. Total plan cost per participant rose 4.0% a year (2016 to 2021). TriNet's 10-K insurance costs per average worksite employee rose 4.2% a year (2019 to 2023), whereas Schedule A premium per person rose 2.5% a year. There are two caveats though. TriNet's “insurance costs” include workers' compensation, so they are not just health. And starting in 2024, its worksite employee count includes COBRA and platform users. Benefitra analysis
- Paychex. It only discloses company wide client retention (81% to 82% for fiscal 2015 to 2019, mostly payroll clients), and no PEO worksite employee counts. Its Form 5500 series also breaks too often to decompose.
- All PEOs pooled (13 per person series and 100 yearly changes, a different sample from the autocorrelation test). Premium per person moves strongly opposite to changes in persons per participant (coefficient −0.70, p < 0.001). It also moves against participant growth (−0.36, p < 0.001). Much of the year to year variation comes from how headcount is defined and timing rather than price. Changes of carrier show no effect (p = 0.25). Benefitra analysis
5.6 What the filings cannot measure, and the question that would
| Cannot be measured from Form 5500 or 10-Ks | Why | Questionnaire item (Appendix A, E9) | Gold standard part |
|---|---|---|---|
| Which clients left or joined, and whether exits followed repricing | One plan level total. Clients not listed. Year end headcounts | Q4, Q6 (lost clients at offered rates), Q15 (retention) | Cohort rule. Parts 1 and 4 |
| Cost trend for the same clients versus new clients | New and existing business pooled | Q7, Q10 (under 12 month clients separate) | Cohort rule |
| Claims versus premium for a defined cohort | Schedule A claims only for experience rated contracts | Q13, Q14 | Part 3 |
| Buy downs and plan changes | No plan design or tier data | Q2, Q5, Q16 | Part 1 (held constant). Part 4 |
| Dependent and tier mix | Persons covered field defective for ADP and many small PEOs | Q3, Q9 | Part 1 |
| How increases are spread across small and large clients | One plan total | Q11, Q12 | Part 2 |
| Self funded costs where no Schedule H is filed | Fully insured plans file no Schedule H | Q17, Q19 | Context |
A tier mix question (enrollment by employee only, plus spouse, plus children, family) is a candidate for the next cycle. Right now it can't be added, because questions stay frozen during a cycle.
5.7 What this means
- Take the one clean long series (Insperity). Public filings back up “roughly the market trend, plus or minus mix and funding, depending on the window.” They do not back up “PEOs beat the market over time.” Inference
- Part of ADP's lower trend comes from a counting effect. The rest remains unexplained. Inference
- Just because there's a lower premium trend over the long run does not mean renewals are lower. It might be due to buy downs, or a changing client base, or survivors (Section 4). Only PEO data from the gold standard cohort can distinguish between them.
6 What the Index method aims to do
The Benefitra PEO Renewal Transparency Index is a proposed, voluntary disclosure method. Each in scope PEO gets asked the same questions. Then we publish whatever each one provided, laid out in the same way for all of them. What gets rated is how fully a PEO discloses its renewal figures and supports them. Price isn't rated, and neither is service quality or whether a PEO fits a particular employer. Appendix A contains the full rules and this section goes through them.
6.1 The gold standard. One cohort, four parts
Benefitra proposal This isn't a regulatory requirement.
- Main cohort. This is every client that had 12 months of experience or more on its renewal date and was offered a renewal during the period. Clients that got an offer and then left are included too, at the rate they were offered. We never compute any part on accepted rates alone.
- Newer clients (under 12 months at renewal) have their own separate figure. They are never mixed in.
Part 1. Headline. This is the like for like renewal at book level.
Headline = (sum of premium at offered renewal rates ÷ sum of premium at prior-year rates) − 1, for the same enrollment on the same plans, networks and deductibles, for every client in the main cohort.
Inference (arithmetic) This gives you the premium weighted mean of like for like increases at the client level, where each client counts in proportion to its share of premium from the prior year. Churn can't change it, because clients who left stay in at the rate they were offered (as long as the PEO can produce the offered rate for every leaver. See Appendix A, E10). Buy downs can't change it either, since plan, network and deductible stay constant. And the choice of average can't change it, because there is just one defined calculation and, once enrollment stays fixed, you get the same result per covered member as per enrolled employee.
Part 2. Distribution. It's the median like for like increase per client along with the shares of clients over 10% and over 20%. Why bother? So large clients can't hide what small groups go through.
Part 3. Claims versus premium (the loss ratio), included for context. It's incurred claims divided by premium for the same cohort and plan year, with definitions given. It is not the renewal measure.
In Part 4 we show retention and actual premium change next to the headline. We report the share of main cohort clients (and of their employees and premium) that renewed, along with the premium change actually observed after exits and plan changes. Then compare that with the headline. The difference shows how much churn and buy downs can make an advertised average look lower than what clients were offered.
6.2 Evidence tiers
- Tier 1 (best). Data at the client level is anonymized and under NDA, with enough detail for Benefitra to recompute every part by itself (the record layout is in Appendix A, E8). It doesn't contain any protected health information. Guidance from HHS says that aggregate figures which don't identify individuals fall outside of PHI [19]. Small cells are suppressed.
- Tier 2. Signed written answers. At this level the PEO does the calculations and a named officer signs off on them. Benefitra can't recompute these numbers, so we publish them as the PEO's own statements.
- Tier 3 (context only). Public filings, which means Form 5500 (all EINs and plan numbers, and only medical Schedule As) and 10-K disclosures for public PEOs. This layer can raise a question but it can't confirm or refute a renewal figure, and on its own it never raises a PEO's level.
6.3 Disclosure levels
Each PEO gets one level, from 0 to 4. This isn't a score. There aren't any weights, points or stars either. Levels 1 and 2 are cumulative. Levels 3 and 4 both build on Level 2, but Level 4 does not need Level 3. So a PEO never has to hand client level data to a broker to get to the highest level.
| Level | Name | Criteria |
|---|---|---|
| 0 | Declined or no response | Stated as a fact with the date. “Declined to answer” or “Did not respond by date.” No speculation about reasons. |
| 1 | Figure defined | The PEO defined its advertised average in writing. Statistic and weighting, cohort (including whether lost clients are excluded), like for like or not, offered or accepted rates, period and scope. |
| 2 | Gold standard figures, signed | Level 1, plus the headline and distribution on the full 12+ month cohort including lost clients at offered rates, plus retention, actual change and loss ratio answers, signed by a named officer. |
| 3 | Recomputed by Benefitra | Level 2, plus de identified client level data under NDA, from which Benefitra recomputed the Level 2 figures. Differences are published. |
| 4 | Independently attested | Level 2, plus an annual attestation of the figures by an independent credentialed actuary or independent CPA firm with no role in the PEO's pricing. The attestation (or a summary the attester approves), the attester's name and the scope of work are published. |
Inference Some PEOs may not track rates offered to clients who have left, or premium at prior year rates for the same enrollment, unless they take extra steps. So in the first cycle most PEOs may end up at Level 0 or 1. That shows what is disclosed today, but it says nothing about pricing.
6.4 Separate performance panel
Each PEO page shows the level along with the date it was assigned and the questions answered. In a visibly separate panel it shows the reported figures, each tagged with its evidence tier, and if a figure is missing it says “not provided.” Price never affects the level. Consider two PEOs with headlines of 4% and 14%. If both disclose the same things with the same support, they get the same level. Interpretation Grading price would punish candor (counting lost clients at offered rates tends to push the headline up), and it would look like steering by a broker who gets paid commissions and sells alternatives to PEOs.
6.5 Reconciliation note
Benefitra compares the actual premium change a PEO reports against public comparators for the same PEO and time period. If the difference exceeds the published tolerance, we add a note. There is never a deduction and never a level change, and the PEO's reply is published right next to it. PROPOSAL The v0.4 draft used a tolerance of 5 points, which is tighter than the noise in the comparators themselves. Take a look at the numbers. The cross PEO spread of one year Form 5500 changes is about 10.6 points, Table 2 shows single year swings ranging from 6 to 19 points, and Insperity's yearly Form 5500 and 10-K changes correlate at only r = 0.52. A 5 point rule would flag honest figures often. This version widens the tolerance to 10 points. It also requires that the difference show up against every available comparator, and a back test of the false flag rate on Insperity's 10-K and Form 5500 history before launch. See Appendix A, E13 for the details and the unit matching rules.
6.6 Annual cycle and conduct
Before sending out the survey we publish the questions, level criteria, tolerance, tier labels and the in scope PEO list, with a version number and a SHA-256 fingerprint. Then they are frozen for the cycle. Every PEO gets the same questions, the same deadline and one follow up. We publish answers exactly as given and state declines as facts. Each PEO sees its draft entry at least 10 business days before publication and can respond or dispute its level (see Appendix A, sections A and F).
7 Methods and data
- Sections 2 through 4 use bulk data from DOL EFAST2 (the f_5500 and Schedule A files) for form years 2019 to 2025, downloaded on August 25, 2026 [7]. The form and instruction text comes from both the 2024 and 2025 editions [1][2][3][21][22].
- Section 5 uses all Form 5500 main filings for filing years 1999 through 2025, along with Schedule A and, if one was filed, Schedule H. Files from 2009 and later are DOL's “Latest” datasets (organized by form year). Earlier files are arranged by plan year end date. We read the SEC 10-K numbers for Insperity, ADP, TriNet and Paychex by hand. Our benchmark is CMS NHE Table 21, employer sponsored private health insurance per enrollee, for calendar years 1987 to 2024 [24].
- Filters. We retained welfare plans with health coverage (benefit code 4A) and Schedule A contracts flagged health, HMO, PPO or indemnity. We did not include cafeteria, FSA or nonmedical plans. For each EIN, plan number and plan year start, we kept only the most recent filing. Premium is the experience rated earned premium plus the non experience rated total charges.
- Tests. We used compound annual growth rates over stated time periods, and a pooled lag 1 autocorrelation of year over year changes that we checked with a permutation test. We compared cross PEO dispersion with what averaging predicts (SD ÷ √years). We also ran 3 year ahead regressions with HAC standard errors, along with a pooled regression with PEO fixed effects. We did not compute confidence intervals and instead show ranges across windows.
- The plan level CSV lists the EFAST2 acknowledgment IDs for each filing used (for filings from 2009 on. Earlier filings carry DOL's pre-EFAST2 filing ID). See Data availability.
| PEO | EIN / plan number | Used in |
|---|---|---|
| Insperity (Administaff) | 76-0178498 / 502 | Tables 1 to 3, 5. Figures 1 to 2 |
| ADP TotalSource | 59-3216484 / 501 (earlier 65-0965364 / 501, 2000 to 01) | Tables 1, 3. Figures 2 to 3 |
| Justworks | 46-2283648 / 501 | Tables 1 to 2. Figure 1 |
| CoAdvantage | 59-3434670 / 501 (plus 502 FSA) | Tables 1 to 2, 4. Figure 1 |
| Paychex Business Solutions | 59-2693969 / 501 | Tables 1, 4 |
| TriNet | Main chain 95-3359658 → 48-1304650 / 501 (HR III), plus HR II, HR IV and others | Tables 1, 4. Section 5.5 |
| G&A Partners | 76-0461926 / 504 (plus 501 and about 19 other plans) | Tables 1, 3 |
| AdvanStaff HR | 88-0300318 / 501 | Table 3 |
8 Limitations
- Our Form 5500 analysis covers plans we could identify by sponsor name and EIN. We might have missed plans filed under unrelated entity names, and PEOs whose clients sponsor their own plans.
- Premium per covered person depends on how we define premium and on carriers' estimates of persons covered. If you pick another reasonable definition you will end up with different numbers.
- We did not open individual filing PDFs (these contain broker names and lists of participating employers), and we also did not query the Form M-1 database [8].
- The explanations we give for unusual data points (the ADP headcount ratio, TriNet HR III plan year 2024, TriNet HR III plans 503 and 504) are based on inference. We haven't actually asked the companies.
- Long run results are sensitive to the start and end years (Tables 5 and Section 5.4). The sample is also biased towards survivors, because only PEOs with long, clean filing records make it into the longer windows. With 5 to 22 yearly points the tests have low power. We did not compute any confidence intervals, and the results show associations rather than causes.
- Plan year 2024 is the newest Form 5500 year. For calendar year plans, plan year 2025 filings are due by October 15, 2026.
- We didn't survey state law comprehensively.
- The level criteria, question map, reconciliation tolerance, scope rules and suppression thresholds are all proposals. The gold standard is Benefitra's proposal. This is not an industry or regulatory definition.
- We go into detail about one published renewal statistic (Rippling). We did not review every PEO's marketing materials.
- Benefitra is not independent of the PEO market (see Disclosures). We design the method so that levels don't rely on Benefitra's judgment of price. And still, the author and owner is Sam Newland, and there is no external reviewer yet.
9 Next steps
- Complete the EIN and plan number map for each in scope PEO, with EFAST2 acknowledgment IDs, and then compare it against the filing PDFs.
- When plan year 2025 filings arrive, refresh Tables 2 and 5.
- Back test the reconciliation tolerance and then publish the false flag rate.
- Pilot the questionnaire with a few PEOs, then refine the wording and the deadline.
- Publish the method, questions and in scope list with a SHA-256 fingerprint. Then send out the survey to every in scope PEO on the same day.
10 Disclosures, license, citation and changelog
Disclosures
- Who we are. Benefitra is a licensed insurance brokerage, and Sam Newland, CFP®, holds licenses for health and life insurance. When clients purchase coverage, Benefitra may earn commissions or fees. That includes coverage bought through PEOs that we discuss in this paper.
- Conflict of interest, on both sides. Benefitra sells PEO arrangements. It also sells alternatives to PEO health plans, such as Taft-Hartley, level funded, self funded and captive options, and it offers second opinions on renewals. So it may benefit both when employers join a PEO and when they leave one. Benefitra has placed business with Prestige PEO (see the published case study [28]).
- Funding. Benefitra paid for this research. No PEO, carrier or other outside party did.
- Not a quote or guarantee. The figures are statistical estimates based on public filings. They are not quotes, they are not guarantees of any renewal or outcome, and they don't represent an actuarial opinion. This paper is research and not legal, tax or actuarial advice.
- AI use. AI tools were used for analysis and drafting (Grok by xAI for research and drafting. Claude by Anthropic for quality control and editing). Before publication, all figures were checked by Sam Newland, CFP®.
- Named companies. What we say about named PEOs is based on their public filings, their own published documents, or a published Benefitra case. We describe it as data, not as conduct.
License
© 2026 Benefitra. Text and tables derived by Benefitra are licensed under CC BY 4.0 (creativecommons.org/licenses/by/4.0/). You may share and adapt them as long as you give credit to Benefitra and a link to this page. Third party data and quotations (DOL, SEC filings, CMS, AHRQ, Rippling, ESAC and PEO documents) stay subject to the terms of their owners. Benefitra's analysis code is not published.
How to cite
Newland, S. (2026). Why PEO Renewal Averages Need Independent Verification. The Benefitra PEO Renewal Transparency Index (Version 0.6). Benefitra. https://benefitra.com/peo-renewal-transparency-index/. Accessed .
Data availability
All inputs are public. They include DOL Form 5500 bulk data [7], SEC 10-K filings and CMS NHE tables. The derived plan level data behind Tables 2 to 5 and Figures 1 to 3 is published on benefitra.com along with this paper, as a CSV (peo-plan-level.csv) with a MANIFEST of SHA-256 hashes. Any other requests should go to the corrections contact below.
Corrections contact. info@benefitra.com. Each correction is logged below along with the date, what was incorrect, what changed and which numbers moved.
Changelog and errata
| Version / date (ET) | What changed |
|---|---|
| v0.6 · 2026-10-16 | Public release. Tables 3 and 4 checked against the plan level CSV and corrected. AdvanStaff HR also qualifies for 10 years per participant (2011 to 2024) and its per person run is 2009 to 2020 at 6.2% a year (was 2010 to 2020 at 7.9%). Prestige ratio shifts are 2009, 2013, 2014, 2022 and 2023 (was 2009, 2013, 2014 and 2018). Oasis 4 / 4 (was 4 / 5). CoAdvantage persons about equal to participants in 2013 to 16 and 2018 to 24 (was before 2018). Vensure 3 / 4 and 9 filed years to 2024 (was 3 / 3 and 10). SouthEast PEO about 1.4k to 2.9k participants (was 2k to 4k). Tilson 6 / 7 and about 70% to 87% paid directly (was 3 / 4 and 71% to 87%). Prepublication checklist removed. Plan level CSV and MANIFEST published, with EFAST2 acknowledgment IDs. |
| v0.5-preview · 2026-09-29 | First web version. Folded the Scorecard Standards (v0.3.1) into this paper as Appendix A and fixed its internal conflicts. Removed leftover score language, scoped the restricted word rule, renamed Level 3 “Recomputed by Benefitra” and let Level 4 (“Independently attested”) be reached without giving client data to Benefitra, widened and justified the reconciliation tolerance, added PEO scope rules and a level dispute path, split Q20, harmonized the data quality flags with the research rules, moved to one version number, and removed the code license (code is not published). Prepublication corrections. Removed a TriNet attrition statement not found in the cited 10-K. Restored TriNet's full 10-K sentence on its 10% worksite employee decline. Added window caveats for Insperity and ADP and ADP's 2012 headcount step. Flagged Justworks 2019 to 2021. Reported the reversion type single PEO results and faster long window narrowing that v0.4 left out. Used active to active counts for Insperity (−2.6%, was −4.5%). Relabelled Benefitra's own analysis (was “Direct”). Used neutral wording for data flags on named PEOs. Used ADP's 10-K client retention estimate. Added two way conflict of interest, AI use and license statements, how to cite, methods and plan table, and this log. Removed internal leftovers. Removed or tightened claims that went beyond the sources. |
| v0.4 · 2026-09-26 | Internal draft. Added the 20 year Form 5500 section (now Section 5) with Figures 2 and 3. |
| v0.3 · 2026-09-26 | Internal draft. Replaced a weighted 100 point rubric with disclosure levels 0 to 4. Added the separate performance panel, reconciliation note and annual cycle. |
| v0.2 · 2026-09-26 | Internal draft. Added the lost clients section. Redefined the gold standard as four parts on one cohort. Expanded the questionnaire from 14 to 20 questions. |
| v0.1 · 2026-09-26 | Internal first draft. |
v0.1 to v0.4 were internal drafts written on the same day and never published. Errata. The Table 3 and Table 4 corrections in v0.6.
11 References
All web sources opened September 26, 2026 (ET) unless stated. ADP 10-Ks and the case study reopened September 29, 2026 (ET).
- U.S. Department of Labor (EBSA), IRS and PBGC. Instructions for Form 5500, 2025 (including Schedule A instructions). dol.gov/…/2025-instructions.pdf
- U.S. Department of Labor et al. Schedule A (Form 5500), Insurance Information, 2024. dol.gov/…/2024-schedule-a.pdf
- U.S. Department of Labor et al. Instructions for Form 5500, 2024 (form year 2024 definitions). dol.gov/…/2024-instructions.pdf
- 29 CFR 2520.104-20, limited exemption for certain small welfare plans (eCFR, as of September 1, 2026). ecfr.gov/…/section-2520.104-20
- 29 CFR 2520.101-2, filing by multiple employer welfare arrangements (eCFR, as of September 1, 2026). ecfr.gov/…/section-2520.101-2
- U.S. Department of Labor, EBSA. Multiple Employer Welfare Arrangements under ERISA. A Guide to Federal and State Regulation, revised April 2022, section 4. dol.gov/…/mewa under erisa…pdf
- U.S. Department of Labor, EBSA. Form 5500 Datasets (bulk EFAST2 f_5500 and Schedule A files, form years 2019 to 2025, downloaded August 25, 2026). dol.gov/…/form 5500 datasets. Individual filings. efast.dol.gov/5500Search (blocked automated access on September 26, 2026. Not used).
- U.S. Department of Labor, EBSA. Form M-1 filing and search system. askebsa.dol.gov/mewa (page opened. Database not queried).
- Benefitra. Analysis scripts and outputs for this paper (plan tabulation, Schedule A detail, funding, carriers, charts), September 26, 2026. Built on 7. Internal. Outputs to be published as CSV.
- Internal Revenue Service. Notice 2002 to 24, Section 6039D reporting requirements. irs.gov/pub/irs-drop/n-02-24.pdf
- Insperity, Inc. Form 10-K for fiscal year 2025 (Item 1, Item 7, Note 1). sec.gov/…/nsp 20251231.htm
- TriNet Group, Inc. Form 10-K for fiscal year 2025 (Items 1A and 7). sec.gov/…/tnet 20251231.htm
- 17 CFR 229.303 (Regulation S-K Item 303), management's discussion and analysis (eCFR, as of September 1, 2026). ecfr.gov/…/section-229.303
- Employer Services Assurance Corporation (ESAC). Standards and Procedures. esac.org/policies/standards-and-procedures
- Rippling. 2026 PEO Trust and Transparency Report (2 page PDF, 2026 to 2027 plan year). assets.ctfassets.net/…/2026_PEO_Trust_and_Transparency_Report.pdf
- Google Search Central. Creating helpful, reliable, people first content. developers.google.com/…/creating helpful content (Appendix A only)
- Google Search Central. Google Search's reviews system and your website and Write high quality reviews (both updated December 10, 2025). developers.google.com/…/reviews system (Appendix A only)
- Google Search Central. Review snippet (Review, AggregateRating) structured data (updated September 8, 2026). developers.google.com/…/review snippet (Appendix A only)
- U.S. Department of Health and Human Services, OCR. Guidance Regarding Methods for De identification of Protected Health Information (last reviewed February 3, 2025). hhs.gov/…/de identification
- Benefitra. PEO renewal average reporting and health based rating. Rules, data, and a 5500 based tracker (internal working paper, September 26, 2026). Not public.
- U.S. Department of Labor et al. Form 5500, 2025 (lines 5, 6 and 7). dol.gov/…/2025-form-5500.pdf
- U.S. Department of Labor et al. Schedule H (Form 5500), 2025 (Part II, lines 2a and 2e). dol.gov/…/2025-schedule-h.pdf
- Benefitra. PEO health premiums in Form 5500 filings, version 1 (1999 to 2024 look at mean reversion) and version 2 (wider PEO coverage and confounders), September 26, 2026. Built on Form 5500 bulk data for filing years 1999 to 2025, SEC 10-Ks of Insperity, ADP, TriNet and Paychex, and the ESAC directory. Internal. Not yet public. Figures 2 and 3 are its charts 01 and v2_02.
- Centers for Medicare & Medicaid Services. National Health Expenditure Accounts, Historical, Table 21, employer sponsored private health insurance per enrollee, 1987 to 2024. cms.gov/files/zip/nhe-tables.zip
- ADP (Automatic Data Processing, Inc.). Form 10-K for fiscal 2026 (client retention “approximately 6 years in PEO”). sec.gov/…/adp 20260630.htm. Form 10-K for fiscal 2025 (“approximately 6 years in PEO”). sec.gov/…/adp 20250630.htm
- ADP. Form 10-K for fiscal 2016 (“approximately 7 years in PEO Services”). sec.gov/…/q4fy1610kinq4fy16.htm. Form 10-K for fiscal 2021 (“approximately 7 years in PEO”). sec.gov/…/adp 20210630.htm
- Newland, S. Do Some PEOs Stay Cheap on Health Renewals, or Does Everyone Revert to the Mean? Benefitra research, v1.0.6 (2026). benefitra.com/peo-renewal-mean-reversion/
- Benefitra. Case study. How a Boston law firm cut 35% on health insurance (ADP TotalSource HPHC HMO quote $155,256 year 1. Prestige PEO + Cigna $3,500 deductible PPO $109,133 year 1. Health only). benefitra.com/case-study/boston-law-firm-37-percent-health-insurance-savings/
A Appendix A. How the Index rates a PEO (Scorecard Standards)
Status. These rules carry the version number of this paper (v0.6), and they will become v1.0.0 at launch. They replace the standalone Scorecard Standards drafts, v0.1 to v0.3.1 (September 26, 2026). The last standalone file had a mismatch (v0.3.1 in its header, v0.3 in its status line), and that file is now retired. The paper, these rules and the questionnaire now share one version number. Each rule has an ID and is written so that a reviewer can mark it pass or fail. A page or release ships only if every applicable rule passes (section G). Anything marked PROPOSAL needs to get a decision from Sam Newland and counsel before it is first used.
A. Conduct and safety
| ID | Rule |
|---|---|
| A1 | Every PEO in scope (section F) gets the same written questionnaire. The format and the date are identical. |
| A2 | One response deadline applies to every PEO. PROPOSAL 30 calendar days. |
| A3 | A PEO that does not respond gets exactly one written follow up, and every nonresponder gets it on the same date. That is the only contact about the survey, other than answering a PEO's questions (and those get logged). |
| A4 | Before the survey goes out we publish the questionnaire, method, level criteria, tolerance and in scope list on the methodology page. We also include a version number and a SHA-256 fingerprint. These items stay frozen for the cycle (E14). |
| A5 | PEO answers are posted exactly as submitted, along with the date they were received. If the sender agrees to be named we include their name and title, but otherwise we just write “PEO representative”. Any summary from Benefitra is labelled “Benefitra summary.” |
| A6 | Declines and nonresponses are stated only as facts. “Declined to answer.” / “Did not respond by date.” / “Answered questions 1 to 8. Declined questions 9 to 20.” We don't guess motives. Counsel must approve this exact wording before it is first used, because a Level 0 entry is its own public statement about a named company. |
| A7 | Any Form 5500 figure that appears next to answers always carries the label “insured premium per covered person (Form 5500), not a renewal increase,” and also the lost client caveat in E15. |
| A8 | Benefitra has conflicts of interest on both sides (B1). We disclose them at the top of every page and also in the survey letter. |
| A9 | Naming and restricted words. The name of the product is “PEO Renewal Transparency Index.” We never use the words “oversight,” “watchdog,” “regulator” or “certified.” We also never say that a PEO's figures were “verified” or “audited” by Benefitra. Some uses are allowed. “verification” only refers to the aim of the method (as in the title of this paper). “attested” is used only for a Level 4 attestation by an independent third party. Benefitra's own checks are called “recomputed by Benefitra” or “data reviewed by Benefitra”. The word “certified” appears only inside the IRS legal term “certified professional employer organization”. We use “regulatory” only when talking about actual law. These words can also show up when quoted in this rule and in G. The prepublish search (G) lists every hit, and each one has to match an allowed use. |
| A10 | No defamatory or loaded wording. Never “sham,” “lying,” “scam,” “fake,” “rigged,” “bait and switch” or “no regulation.” We just describe what a PEO disclosed or filed, and we never characterize intent. If a PEO has data quality issues in its filings, those issues are described as neutral data flags (for example “persons covered about equal to participants (flagged)”) and never called errors or conduct. |
| A11 | Counsel review. An outside lawyer familiar with insurance advertising and defamation reviews the survey letter, the methodology page, this paper and the first published entries. The reviewer's name and the date go in the changelog. |
| A12 | Right of reply. Each PEO receives its draft entry, along with every statement about it in any Benefitra research paper (this one included), at least 10 business days before publication PROPOSAL. It can send a written reply, and we publish it in full alongside the entry or statement. |
| A13 | Corrections. A PEO or any reader can request a correction at any time at info@benefitra.com. Once confirmed, factual errors are corrected within 5 business days PROPOSAL, and they are recorded in the changelog and errata. |
| A14 | Levels measure disclosure and nothing else. Each page carries this statement. “This level reflects what the PEO disclosed about its renewal figures. It does not rate price, service, or suitability for your business.” |
| A15 | Disputes. During the reply window a PEO may dispute its level, or any factual statement, in writing. Its entry is then withheld from publication until the dispute is decided, but that delay can't run past 30 days after the window closes. Who decides? A reviewer who did not draft the entry PROPOSAL (either outside counsel or an independent advisor named on the methodology page). The decision and also the reasons are published along with the entry. |
B. Reader trust and search
Google's guidelines ask whether authorship is “self-evident,” whether readers can see “how the tests were conducted,” and whether there is disclosure about automation use. They also say that review snippets for organizations need ratings “sourced directly from users” [16][17][18]. Direct
| ID | Rule |
|---|---|
| B1 | Disclosure box at the top of every Index page, above the level. “Benefitra is a licensed insurance brokerage. It may earn commissions from PEOs listed here. It also sells alternatives to PEO health plans (such as Taft-Hartley, level funded, self funded and captive options) and offers renewal second opinions, so it may benefit when employers leave a PEO. Every PEO is rated with the same published method, whether or not Benefitra places business with it.” |
| B2 | Every PEO is treated under the same rules, and that includes PEOs Benefitra places business with. That means no extra follow ups, no earlier previews, no softer wording or better placement. Listings are sorted alphabetically and that's it. |
| B3 | Show the evidence on every PEO page. Use verbatim answers and links to each Form 5500 filing used (EIN, plan number, plan year, acknowledgment ID) and also the 10-K section. Dates received. A “last updated” date. Links to the changelog and errata. |
| B4 | Each page carries a byline. “Sam Newland, CFP®, licensed health and life insurance agent and founder of Benefitra,” and it links to an author page that has a bio, license types and states. Always use the ®. Never write “a CFP” as a noun. |
| B5 | Every page has a statement about AI use. It names the models used and the person who checked every figure. |
| B6 | There are no star ratings and no Review or AggregateRating structured data. Levels are shown as plain text (“Disclosure level 2 of 4”). |
| B7 | Required structured data. ScholarlyArticle (or Article) JSON LD with a Person author, datePublished, dateModified, version, license and citation. Dataset markup on each downloadable data file. Highwire citation_* meta tags on research pages. |
| B8 | Titles are neutral and follow this pattern. “PEO name. PEO Renewal Transparency Index entry (2027 cycle).” No superlatives, no ranking language and no questions that suggest wrongdoing. |
| B9 | Be honest about dates. dateModified is updated only for substantive changes, and those changes are logged. |
| B10 | Every factual statement links to a primary source (DOL, EFAST2, eCFR, SEC, the PEO's own documents), or it has a label that says it is a Benefitra calculation or interpretation. |
C. Site structure on benefitra.com
| ID | Rule |
|---|---|
| C1 | Hub page (planned. /peo-renewal-index/. Final URL confirmed at launch). It has a disclosure box and an explanation in plain language. There's also an alphabetical table of in scope PEOs with their disclosure status, plus links to each PEO page and to the methodology. |
| C2 | Per PEO pages (planned. /peo-renewal-index//), same template for every PEO. |
| C3 | Methodology page. It contains the gold standard, questionnaire, levels and question map, tolerance, scope rules, annual cycle, conduct and data rules, version number, changelog and errata. Before launch this paper acts as the methodology page. |
| C4 | This is the order on every PEO page. (1) disclosure box. (2) PEO name, date, version. (3) level, dated, with the questions answered. (4) a separate performance panel with tier labels and any reconciliation note. (5) verbatim answers. (6) public data layer, labeled according to A7. (7) the PEO's reply, if there is one. (8) sources. (9) service box. |
| C5 | The service box follows the evidence and sources. It is visibly separate, labelled “Benefitra service,” and is identical on every PEO page. “Facing a PEO renewal? Get a free second opinion from a licensed broker.” We don't have any calls to action inside level tables, answer blocks or the hub table. |
| C6 | Internal links. The hub page links to the PEO renewal article, the Benefitra Renewal Index research and the Health Plan Funding Simulator, and each of those links back to it. Make sure to check the live URLs before launching. |
| C7 | Downloads on the methodology page. Data files in CSV format along with a SHA-256 manifest, a changelog, errata and a license statement. Code is not made public. |
| C8 | There is just one canonical home and that is on benefitra.com. Sister sites link to it rather than republishing it. No external hosts for data or code either. |
D. Data handling
| ID | Rule |
|---|---|
| D1 | Every Form 5500 figure carries the label “insured premium per covered person (Form 5500, plan year X, plan level)”. It is never called a renewal, a rate increase or a price change, and the definition of premium is stated. |
| D2 | Work per plan rather than per carrier. Map every EIN and plan number used by a PEO group. Only plans with medical coverage (code 4A) and medical Schedule As are included, while cafeteria, FSA and nonmedical plans are left out. Each PEO page displays the map. |
| D3 | Data quality flags, aligned with the research rules (Section 5.1). PROPOSAL We flag (a) a missing plan year, or a filing that is an amendment. (b) persons covered ÷ participants moving more than 30% from the prior year. (c) premium per covered person or per participant changing more than 30% in a year. (d) participant counts at the 32,767 field cap. (e) persons covered roughly equal to participants (ratio under 1.1), which suggests that employees were counted rather than members. (f) the medical Schedule A count changing by more than 30%. A flagged value is shown along with its flag. It is never silently dropped. The v0.3.1 draft used different thresholds (±15% and ±25%). Those are withdrawn so that the page and the research flag the same series in the same way. |
| D4 | Use the most recent filing for each EIN, plan number and plan year, and note its acknowledgment ID and received date. If the DOL updates its datasets, pull the data again. |
| D5 | No PHI, ever. We never ask for, accept or store individual level data (names, dates of birth, claims, diagnoses, member IDs). If a PEO sends some anyway, we delete it, confirm the deletion in writing and record what happened. |
| D6 | Tier 1 data comes only under a signed NDA, and that NDA covers purpose, storage, access list, retention and deletion date. Client names are replaced by codes that the PEO assigns. The record layout follows E8. |
| D7 | PROPOSAL A cell (for example one PEO × one size band) is published only when it has at least 10 client groups, and percentiles need at least 20. If one client makes up more than 20% of a cell's premium, that cell is suppressed. Groups under 5 enrolled employees get no cells unless the cell has at least 20 groups. Percentages are rounded to one decimal place, and a suppressed cell shows “suppressed (small cell).” |
| D8 | One version number covers the paper, these rules and the questionnaire (v1.0.0 at launch). Nothing changes during a cycle. Between cycles, any change has to have a written rationale and a changelog entry, posted at least 30 days before the next survey goes out. Older versions remain readable. |
| D9 | Each published set of entries is frozen into a dated snapshot with a SHA-256 manifest of its data files. Pages then link to the snapshot used. |
| D10 | Licenses. Benefitra text, tables and derived data are licensed under CC BY 4.0. PEO verbatim answers and third party documents stay under their owners' rights, and we quote them with attribution. DOL and SEC data are U.S. government works. Analysis code from Benefitra is not made public and is not licensed for reuse. |
| D11 | Reproducibility (internal). We use relative paths and pinned requirements, along with a single command that rebuilds the published tables from the raw DOL files. Outside readers compare results against the published CSV and the public DOL files. |
E. Index rules. Gold standard, tiers, questionnaire and levels
In the standalone drafts these rules used to be numbered G1 to G15. That conflicted with a Sources section also labelled G. They are now renumbered E1 to E15.
| ID | Rule |
|---|---|
| E1 | Every gold standard figure uses one cohort. That is every client with 12+ months at renewal that was offered a renewal in the period, at the offered rate, and this includes clients who got an offer and then left. Clients under 12 months are counted as a separate figure. |
| E2 | Headline = (sum of cohort premium at offered renewal rates ÷ sum of the same enrollment's premium at prior-year rates) − 1, same plans, networks and deductibles. Pages explain that this is equal to the premium weighted mean of client like for like increases. Show both dollar totals if they are provided. |
| E3 | Distribution. Right next to the headline, show the median client like for like increase and also the share of clients above 10% and above 20%. Percentiles and size bands should be included if they are provided (subject to D7). |
| E4 | Loss ratio is incurred claims ÷ premium, for the same cohort and plan year. It's labelled “claims versus premium (context, not the renewal measure),” and the definitions from the PEO are shown. |
| E5 | Show retention (clients, enrolled employees, prior year premium) along with the actual realized premium change after exits and plan changes. The gap between that and the headline is labeled “difference due to exits and plan changes.” |
| E6 | Plan changes, buy downs and network changes each get their own number. None of these are ever blended into the headline. |
| E7 | Each figure has a tier of evidence. Tier 1 is “recomputed by Benefitra from PEO data”. Tier 2 is “PEO statement, signed by title”. Tier 3 is public filings, and these are there only for context (per A7 and D1). On its own, Tier 3 never raises a level. |
| E8 | The Tier 1 record has one row per client renewal and contains no PHI. It holds the renewal month. Months of experience (12+ / under 12). Size band. State. Funding type. Enrolled employees and members. Premium at prior year and offered rates for the same enrollment and coverage. Plan, network or deductible change (Y/N, type). Renewed or left. Actual premium after renewal. Group level incurred claims. |
| E9 | The questionnaire goes to every PEO unchanged. A. Current figure. Q1 statistic and weighting. Q2 like for like? Q3 offered or accepted rates? Q4 lost clients included at offered rate? Q5 plan changes included? B. Cohort. Q6 main cohort counts including clients that left. Q7 under 12 month count, reported separately. Q8 other exclusions. C. Headline. Q9 book level like for like with dollar totals. Q10 same for under 12 month clients. D. Distribution. Q11 median, above 10%, above 20%. Q12 optional percentiles and size bands. E. Loss ratio. Q13 same cohort loss ratio. Q14 definitions. F. Retention and actual change. Q15 retention and 90 day exits. Q16 actual realized change and gap split. G. Context. Q17 funding type. Q18 state mix and period. Q19 scope. H. Evidence. Q20a will a named officer sign the written answers (Tier 2)? Q20b can you provide anonymized client level data under NDA (Tier 1)? Q3 asks for figures both per covered member and per enrolled employee. |
| E10 | Leavers' offered rate. Suppose a leaving client never received a formal offer. In that case the PEO may use the rate its renewal method produced for that client, but it has to disclose that it did this. PROPOSAL A PEO that can't produce offered rates for leavers can't get to Level 2, and the page lists the questions that were not answered. |
| E11 | Levels and question map. Levels take the place of any score, weights, points or stars. Level 0 means declined or no response (A6 wording). Level 1 requires Q1, 2, 3, 4, 5, 8, 18, 19. Level 2 requires everything in Level 1 along with Q6, 7, 9, 10, 11, 13, 14, 15, 16, 17 and Q20a (officer signature). Level 3 (“Recomputed by Benefitra”) is Level 2 plus Q20b, and Benefitra recomputes Q6, 7 and 9 to 16 (Q12 included). Level 4 (“Independently attested”) is Level 2 plus an annual attestation by an independent credentialed actuary or independent CPA firm that has no role in the PEO's pricing, and the attester's name and scope are published. Level 3 is not required for it. Q12 is optional at every level. Answering “Industry standard,” “proprietary” or just part of a level's questions leaves the PEO at the level below. PROPOSAL |
| E12 | Separate performance panel. The level is displayed along with its date and the questions answered. The reported figures, with tier labels, are in a visibly separate panel. A missing figure shows “not provided.” Price and performance never affect the level, and the methodology page explains why (Section 6.4). |
| E13 | Reconciliation note, never a deduction and never a level change. PROPOSAL (a) Comparators: the 10-K change in health cost per covered employee (public PEOs), and the Form 5500 change in insured premium per covered person for the matching plan year where no D3 flag is triggered. (b) Units: compare like with like: the PEO's per-enrolled-employee figure with the 10-K per-covered-employee figure, and its per-member figure with Form 5500 per covered person. (c) Tolerance: 10 percentage points from every available comparator, applied to the PEO's actual realized change; a headline more than 10 points below every comparator is also noted. Why 10, not 5: the comparators are noisy. The cross-PEO spread of one-year Form 5500 changes is about 10.6 points; single-year swings of 6 to 19 points appear for PEOs with clean series (Table 2); and even for Insperity, the Form 5500 and 10-K yearly changes correlate only at r = 0.52. A 5-point rule sits well inside that noise and would note honest figures often. 10 points is about one cross-PEO standard deviation, and requiring the gap against every comparator lowers false notes further. (d) Back-test before launch: apply the rule to Insperity's 2006–2024 history, treating the 10-K change as the “reported” figure and the Form 5500 change as the comparator, and publish the share of years that would have been noted. If that false-note rate is above 10%, widen the tolerance and say so. (e) Lag and asymmetry: for a 2027 renewal the newest Form 5500 is usually plan year 2024, and private PEOs have no 10-K. If periods can't be matched the page reads “no matching public data for this period,” and each page says which comparators exist. Having fewer comparators is neither a favorable nor an unfavorable signal. (f) Wording: “The reported figures do not reconcile with public filings within the published tolerance,” followed by the figures, sources and periods. The PEO sees it in its draft entry (A12), and its response gets published next to it. |
| E14 | Annual cycle. Before the survey we publish the questions, level criteria, tolerance, tier labels and the in scope list with a version number and a SHA-256 fingerprint. These are frozen for the cycle. Every level and figure is dated. We rerun the survey every year. Levels from prior cycles remain visible, labelled with their cycle, and they are not carried forward. Changes follow D8. |
| E15 | Show this wherever Form 5500 figures appear. “Form 5500 is a plan level snapshot. It does not show clients that left, offered versus accepted rates, or client level data, so exits can make premium per person look lower.” Participant counts at the beginning and end are shown only as “net change in participants (not client retention).” |
F. Scope. Which PEOs are in the Index
| ID | Rule |
|---|---|
| F1 | PROPOSAL A PEO is in scope for a cycle if two conditions are met on the published scope snapshot date. It offers health coverage to client employees in at least one U.S. state. And it meets at least one of these. (a) it appears in ESAC's public directory of accredited PEOs. (b) it's on the IRS public list of certified professional employer organizations. (c) it sponsors a health plan under its own EIN with 1,000 or more active participants in the latest Form 5500 year. |
| F2 | The in scope list is published with the method before the survey (A4), along with the reason each PEO qualifies and the snapshot date. No PEO is added or removed during the cycle. |
| F3 | Scope ignores any commercial relationship with Benefitra. A PEO can't be left out because Benefitra places business with it. And it can't be added because Benefitra competes with it. |
| F4 | A PEO outside the rules can request inclusion in the next cycle. We keep track of the requests and the decisions. |
| F5 | If a PEO went out of business or merged before the snapshot date, it is listed as out of scope, with a note about the reason. |
G. Prepublish checklist
Tick every box. A single “no” blocks publication.
- A1 to A4, F1 to F2. Every in scope PEO received the same questionnaire, the same deadline and just one follow up. First the method, questions and scope list were published and fingerprinted.
- A5 to A6. Answers are verbatim and include dates. Declines use the approved language.
- A9 to A10. Search through the page source for oversight, watchdog, regulator, audit, certified, verified, verification, attested, sham, lying, scam, fake, rigged, bait, “no regulation”. Every hit has to match an allowed use under A9.
- A11. Counsel sign off is recorded, with name and date.
- A12, A15. Each PEO had its draft entry and all statements about it for the full reply period. Disputes are settled and responses are published.
- A14 and B1. At the top of every page is the scope statement and the two way disclosure box.
- B2. Each PEO receives the same templates and wording. The order is alphabetical.
- B3 and B10. Each number is linked to a source or is labelled a Benefitra calculation. There are also filing links and acknowledgment IDs.
- B4 to B5. The byline has CFP®, the author page is live, and the AI use statement names the models and the checker.
- B6 to B7. There is no markup for Review or AggregateRating, and the required markup checks out as valid.
- B8. Titles and headings are neutral.
- C4 to C5. Page order is right. The service box comes after the evidence, it's labelled, and it's identical everywhere.
- C6. Every internal link resolves to a live URL.
- D1 to D3. Every Form 5500 figure is labelled. The EIN/PN map is displayed. Flags show up where they are triggered.
- D5 to D7. No PHI at all. There is an NDA on file for any Tier 1 data. Small cells are suppressed.
- D8 to D11. Version number, changelog, errata, a dated snapshot with SHA-256 manifest, and a license statement are all there. No code is published.
- E1 to E6. There's one cohort, and it includes lost clients at offered rates. The under 12 month figure is separate. The headline formula is explained. Distribution, retention gap and loss ratio are all shown.
- E7 to E8. Each figure is labeled with its tier. Tier 1 data matches E8 and contains no PHI.
- E9 to E11. The questions went out unchanged. Every level was assigned strictly by the published map. And there are no scores, points, weights or stars of any kind anywhere.
- E12 to E13. Level and figures are shown in separate panels. The reconciliation ran against the published tolerance, and its back test has been published. No note changed a level.
- E14 to E15. The criteria didn't change during the cycle. Each level has a date. The lost client caveat shows up wherever Form 5500 figures appear.
- Someone else besides the author checked each figure against the source files.
H. Standards changelog
- v0.5-preview (2026-09-29). Folded into the paper as Appendix A. Changes. Scope rules (F) and dispute path (A15) added. Score language removed and listing order alphabetical only. A9 scoped to allowed uses. Level 3 renamed “Recomputed by Benefitra” and Level 4 “Independently attested,” with Level 4 reachable without Level 3. Q20 split into Q20a and Q20b. Leavers' offered rate rule (E10). Tolerance widened from 5 to 10 points with reasoning, unit matching and a required back test (E13). D3 flags harmonized with the research rules. D8 and the annual cycle made consistent. B1 disclosure made two way. Right of reply extended to research papers. The MIT code license, code downloads and repository citation file removed. G rules renumbered E. An internal placeholder for the decision maker replaced with Sam Newland. Drafting folder references removed.
- v0.3.1 (2026-09-26). Cross references updated to paper v0.4 (no rule changes). Its status line wrongly read v0.3.
- v0.3 (2026-09-26). Weighted rubric replaced by cumulative levels 0 to 4 and a question map. Separate performance panel. Reconciliation note. Annual cycle.
- v0.2 (2026-09-26). Gold standard, evidence tiers, Tier 1 record and 20 question list added.
- v0.1 (2026-09-26). First draft.