
In this article 10 sections
- Fully insured wins when pooled pricing beats the group's own risk
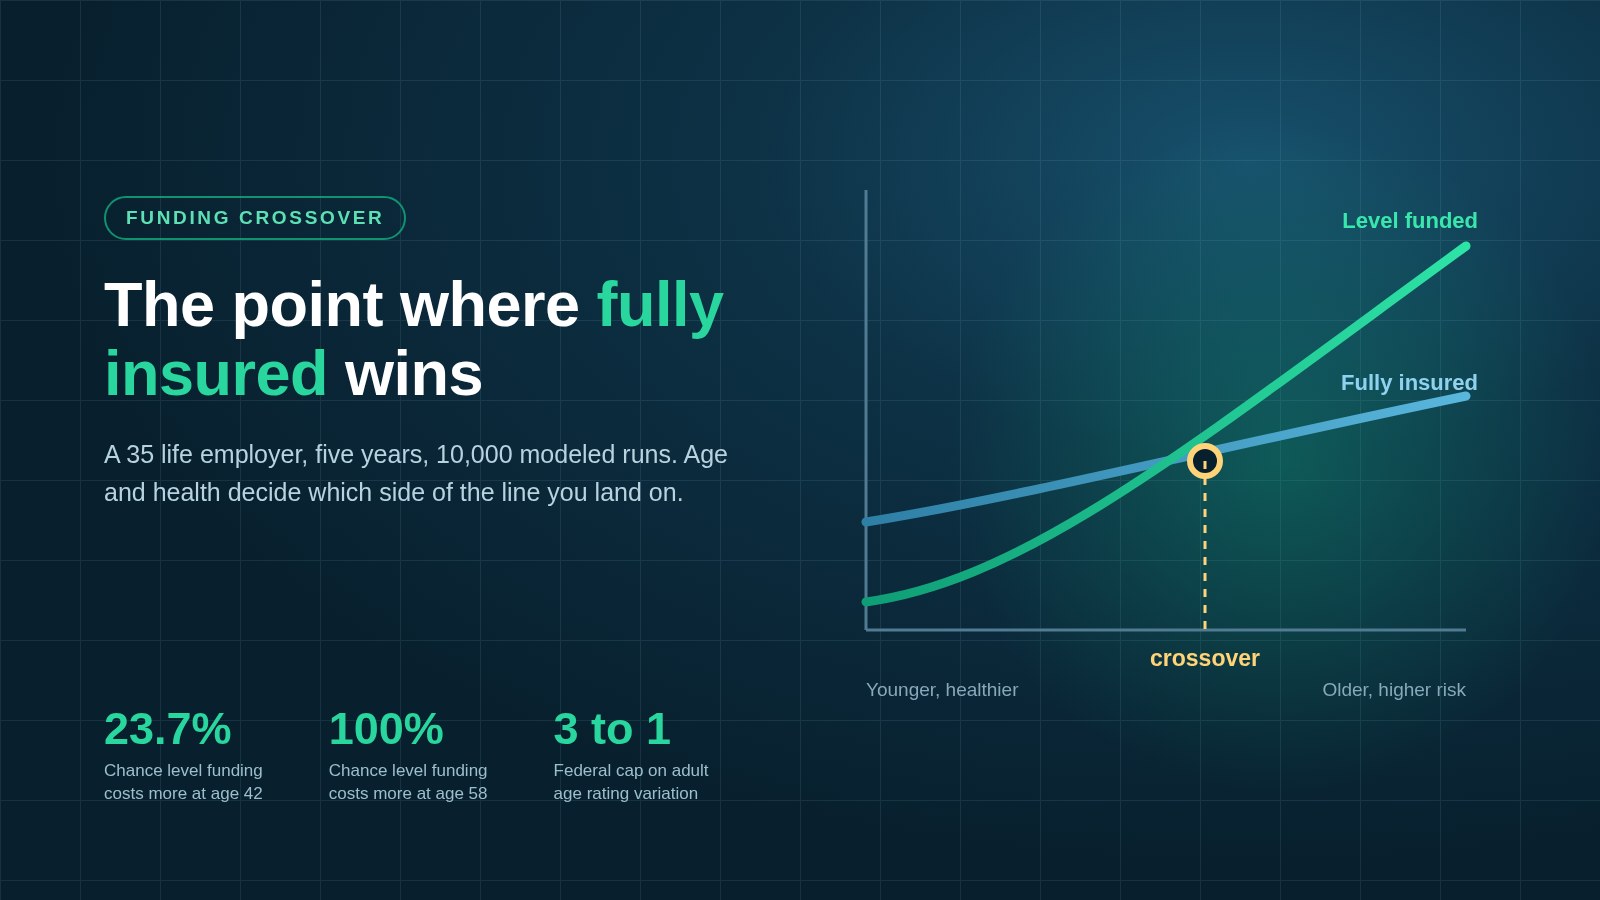
- A 35 life model shows where the crossover occurs
- Age moves the crossover even when headcount stays fixed
- One expensive member can reshape a small group's year
- The median does not describe the bad tail
- Level funding still wins for many healthy small groups
- Four contract fields, including stop loss insurance, can overturn the model
- A funding decision needs three side by side tests
- Questions to take to a broker or finance review
- Author and review note
Fully insured is not merely the cautious alternative to self funding. For some small employers, it is the lower cost choice.
The carrier's pooled premium may cost less than the risk embedded in the employer's own census and claims outlook. The boundary moves. Age, health, contract design, and the starting quote can reverse the answer.
The analysis below uses one controlled scenario to show that boundary. It compares fully insured with level funding only. It does not claim that either option is cheapest among every funding arrangement.
Fully insured wins when pooled pricing beats the group's own risk
In the small group market, a carrier cannot simply price each member from their medical history. Federal rules permit rating based on family composition, geography, age, and tobacco use, with adult age variation capped at 3 to 1. That structure can protect a group whose expected claims are worse than its rating profile suggests. The exact application varies with market and state rules, but the federal boundary is set out in the premium rating requirements at 45 CFR 147.102.
Level funding changes the bargain. In a fully insured plan, the employer pays a fixed premium that is capped for the entire plan year, while level funding reflects the group's own expected claims even if the monthly payment is fixed. A healthy census may earn a lower expected cost. A less favorable census may not.
So the useful question is not whether self funding is broadly better. Ask something narrower: does pooled pricing deliver more value than the savings available from carrying this group's risk?
A 35 life model shows where the crossover occurs
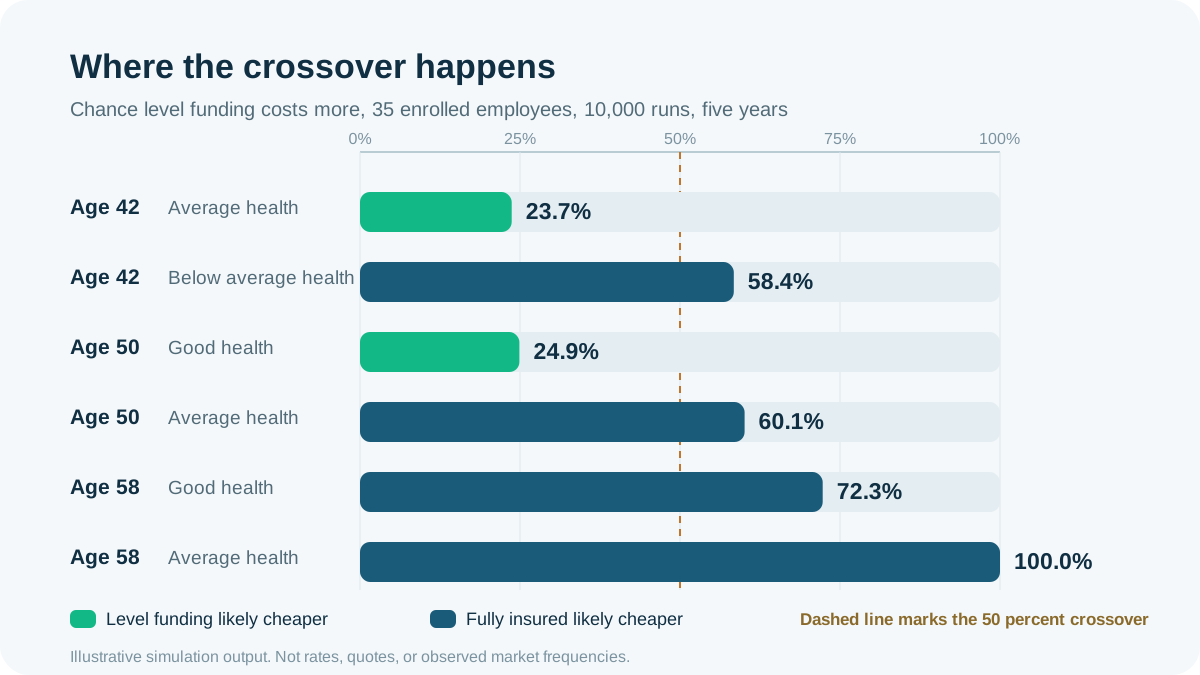
Benefitra ran a controlled Massachusetts scenario with 35 enrolled employees, a fixed seed of 20260704, 10,000 runs, and a five year horizon. Only average age and health status changed. The comparison below pairs current fully insured costs with level funded costs inside the Benefitra Funding Simulator.
| Average age | Health input | Chance level funding costs more | Median result for level funding |
|---|---|---|---|
| 42 | Average | 23.7% | $383,194 lower cost |
| 42 | Below average | 58.4% | $69,258 higher cost |
| 50 | Good | 24.9% | $393,750 lower cost |
| 50 | Average | 60.1% | $94,466 higher cost |
| 58 | Good | 72.3% | $263,551 higher cost |
| 58 | Average | 100.0% | $1,019,959 higher cost |
These are model outputs, not observed market frequencies. They are not rates, quotes, or actuarial advice. The value is the crossover itself: modest input changes can turn a likely level funded advantage into a likely fully insured advantage.
Age moves the crossover even when headcount stays fixed
The age effect is visible before any health input changes. In this model, the fully insured five year median rose from $2,629,076 at age 42 to $4,064,551 at age 58. Level funded expected claims rose differently, so the relative position of the two options changed rather than moving in parallel.
At age 50 with good health, level funding cost more in 24.9 percent of runs and had a $393,750 median advantage. Change only the health input to average and it cost more in 60.1 percent of runs, with fully insured ahead by $94,466 at the median. The inputs and results can be reproduced in the funding comparison model.
A quote can still contradict the model. Carrier strategy, network, geography, and renewal timing affect real pricing. The finding is not that age decides the answer. It is that a funding recommendation made before the census and quotes are loaded has skipped the decisive work.
One expensive member can reshape a small group's year
Health spending is concentrated. AHRQ found that the highest spending 1 percent of people accounted for 21.7 percent of United States health care spending in 2022, while the highest spending 5 percent accounted for 49.7 percent. The agency's analysis of medical expenditure concentration used nationally representative expenditure data.
Concentration matters more when the denominator is small. Cancer treatments can exceed $200,000 in the first year, which is why catastrophic claims can reshape a small group's results so quickly. One claimant among 35 enrolled employees represents far more of the group than one claimant among several thousand. Aggregate stop-loss insurance limits total annual plan costs, but it does not erase the pricing, contract, and renewal effects attached to a difficult year or broader healthcare spending pressure.
Pooling creates economic value. Fully insured transfers the covered claims obligation to the carrier in return for a known premium. When that transfer is inexpensive relative to the group's modeled risk, certainty becomes more than emotional comfort. It carries a measurable price, and sometimes that price is favorable.
The median does not describe the bad tail
A median answers what happened near the middle of the simulated distribution. It does not answer how painful the unfavorable outcomes became.
Cash tolerance makes the distinction decisive. Two options may have similar median costs while one creates a wider range of results, tighter refund conditions, or more exposure at renewal. An employer with low risk tolerance that cannot absorb the adverse tail may favor the stability and simplicity of a fully insured health plan rather than choose from the median alone.
The health plan risk assessment guide explains how cash flow, claims volatility, and fiduciary capacity change the practical funding choice. For a finance review, compare the median, an unfavorable percentile, and the maximum contractual obligation. Then ask whether the organization can fund each outcome without cutting benefits or disrupting operations. Employers without strong internal administrative support often prefer insured health plans because the insurer handles claims administration, lowers administrative burden, and organizations lacking internal administrative resources are often better served by a model where the carrier assumes risk.
This is a solvency question. Give it more weight than a projected savings figure presented by itself.
Level funding still wins for many healthy small groups
The crossover does not make fully insured the default. In the same scenario, age 42 with average health gave level funding a $383,194 median advantage, and level funding cost more in only 23.7 percent of runs. At age 50 with good health, its median advantage was $393,750.
Those results show why a universal rule fails in both directions. Healthy groups can benefit when their expected claims are lower than the assumptions buried in a pooled premium, and self funded health plans may also create cost savings through lower premium taxes. Level funding may also provide useful reporting and a possible surplus return, subject to the actual contract, since some self insured plans can refund unspent claims and give employers greater control to customize benefits than a fully insured plan with limited flexibility.
Those potential savings can also come from lower administrative fees in some self insured health plan arrangements.
KFF reported that 67 percent of covered workers were in self funded plans in 2025, but the share was only 27 percent among workers at firms with 10 to 199 workers. That split in the 2025 Employer Health Benefits Survey shows that firm size still shapes adoption. It does not prove which arrangement will win for a particular employer.
Four contract fields, including stop loss insurance, can overturn the model
Illustrative modeling is a screen. The proposal controls the deal.
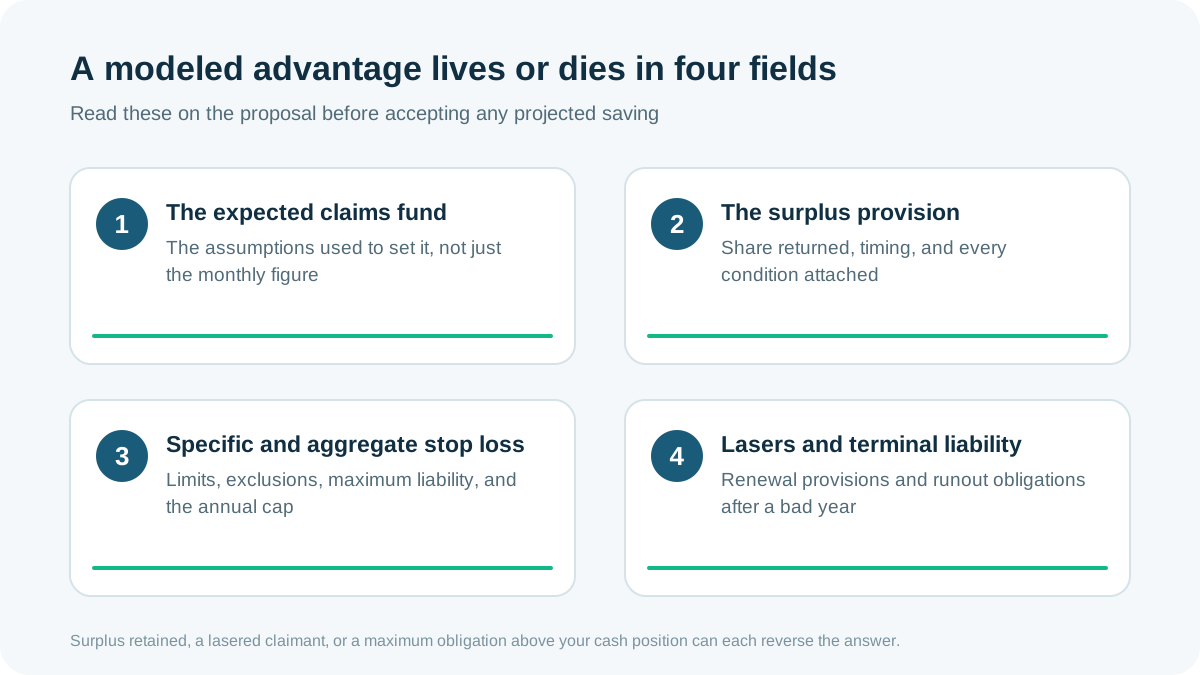
Review these fields before accepting a projected advantage:
- The expected claims fund and the assumptions used to set it.
- The surplus provision, including the share returned, timing, and conditions.
- The specific and aggregate stop loss limits, exclusions, maximum liability, and how aggregate terms cap total annual plan costs; in some contracts, individual stop-loss coverage attaches after $50,000 in claims as protection against large claims.
- Any lasers, terminal liability terms, renewal provisions, or runout obligations, since lasers or other stop-loss terms can exclude high-risk individuals from stop loss coverage and reduce expected loss coverage.
A promising median can disappear if surplus is retained, a claimant is lasered, or the maximum obligation is too high for the employer's cash position. State rules can also affect stop loss availability and attachment points. Benefitra's state stop loss rules guide provides the next jurisdiction specific check.
A funding decision needs three side by side tests
Run three views with the same census and benefit design.
First, compare the actual carrier premiums and fixed fees. Second, model the claims distribution and contract maximum rather than a single expected value. Third, test the operational burden, including reporting, compliance, cash timing, and the work required after a difficult claim year; one of the key differences in insured vs funding is that with self-funded coverage the plan sponsor takes on more financial responsibility for administration, claims oversight, and compliance, often through a third-party administrator, and self-funded plans are less regulated than fully insured plans but still carry more compliance requirements and financial risk.
By contrast, in a fully insured arrangement the insurance carrier handles all aspects of claims processing, which can reduce distraction from core business operations and avoid much of the ERISA-facing burden.
The answer should survive all three. If fully insured wins only because the self funded model uses an inflated claims assumption, repair the assumption. If level funding wins only at the median but creates an unaffordable adverse outcome, the savings may not be financeable.
Employers also need to distinguish funding economics from filing obligations. The level funded and self funded filing guide covers the reporting side that a cost model cannot settle, while fully insured plans exempt employers from navigating complex federal regulations like ERISA.
A reproducible recommendation should show its inputs, its contract reading, and the point at which the result flips.
Questions to take to a broker or finance review
Use the meeting to expose the crossover, not to collect another summary of plan types.
- What exact claim level makes fully insured cheaper than level funding?
- Which census assumptions drive that result most strongly?
- What is the employer's total maximum obligation under the proposal?
- How much surplus returns to the employer, and under what conditions?
- Are any known claimants excluded, lasered, or treated differently at renewal?
- What happens if the actual claims experience lands in the unfavorable tail?
- Which result changes when the current carrier quote is replaced with the final quote?
Ask for the model file or a reproducible output. A recommendation that cannot be rerun after the quote changes is already stale.
Frequently Asked Questions
When is fully insured better than self funded?
Fully insured can be better when pooled premiums are lower than the employer's own expected claims and risk costs, or when the adverse outcomes under self funding exceed the employer's cash tolerance. It is also the traditional route: you pay a set premium to the insurance company, and the carrier, not the employer, pays covered medical claims and takes the risk on future medical claims. The answer requires a current census, real quotes, and contract terms.
Is fully insured always safer for a small employer?
In a traditional insurance policy or group health insurance model, it transfers covered claims risk to the carrier and makes monthly premiums predictable. Under this health insurance plan structure, premium rates and premium obligations are known in advance. That does not make every fully insured offer economical. Network, benefits, renewal terms, and premium level still require comparison.
Can level funding cost more than fully insured?
Yes. It can cost more when the claims fund, fixed fees, stop loss terms, and actual claims outweigh the fully insured premium. In a self insured or self insured health plan arrangement, the employer assumes responsibility for paying medical claims, although eligible claims may later be reimbursed under stop-loss terms. Surplus provisions and the contract maximum must be included in the comparison.
Does a healthy group always save with level funding?
No. Many employers pursue self funded plans to save money and gain access to claims data, but those advantages do not guarantee lower costs in every case. Better expected health can improve the case, but age, geography, carrier pricing, plan design, fees, and contract terms can reverse it. Health status is one input, not a verdict.
What should a small employer compare first?
Start with the same census and the same group health plan or health benefit design across actual proposals. Compare total expected cost, an unfavorable claims outcome, maximum contractual liability, and the administrative work attached to each arrangement. If you are also weighing options outside a standard structure, details like family coverage or reimbursement of individual premiums can affect the comparison.
Author and review note
Samuel Newland, CFP is the founder of Benefitra and the operator behind its funding discovery framework.
This article is educational. The model outputs are illustrative and are not an insurance quote, actuarial certification, legal advice, or a prediction of any employer's claims. Use current proposals, plan documents, claims information, and qualified professional review before changing a health plan funding arrangement.