Plain language summary
Employers really want to know one thing. What will our health plan cost next year? In the small group market, insurance carriers have to file their rates for the coming year with the state, and they do it months ahead of time. So the most straightforward answer is just to look at that filing. If there is no filing we can use, we estimate the renewal with our own open method (which we call the Benefitra Renewal Index). It uses the state's recent filed rate changes and gives the most recent year the same weight as the smoothed history that came before it. For five year planning we use the state's six year filed average. That window is a judgment call, not a tested optimum. We ran the method on a federal rate filing panel that covers 50 states plus DC and found that borrowing the state's smoothed path did better than a carrier's own recent history, cutting error by roughly 0.7 to 1.0 percentage points. Does a carrier's requested rate predict what happens the following year? We also looked into that and found that it doesn't. Large groups don't have public filings, and this paper does not publish a model for them either. This is research though. It's not meant to be a quote.
Key findings
- There is no single index that predicts health insurance renewals. Small group prices are filed with the state, so you can read them. Large group prices are experience rated and have no public filing. So you should treat these as two separate problems.
- Some context for 2027. PwC projects a 9% commercial medical cost trend for 2027 and calls it the highest in 17 years.1 KFF measured realized 2025 employer premiums up 6% for family coverage and 5% for single.2 Those are different measures for different years. So the gap between them doesn't measure health plan buydowns.
- An equal weight smoother makes a sound rule for filling gaps, but at a national level it has not been shown to be a clear winner. We did an 18 year rolling test on a national series, and the EWMA with α = 0.5 produced the lowest RMSE (2.263). Naive last year tied it on MAE though (1.761 versus 1.762), and the difference in RMSE is not statistically significant either. That national series is also partly reconstructed (see Section 5). The CMS state panel (n = 454) has the stronger evidence. On that panel the same rule had the lowest RMSE at 4.391, compared to 5.008 for naive last year.
- Is a carrier filing missing? Then follow the state. Across 3,964 issuer test observations the state EWMA (RMSE 6.484) and a 25% carrier / 75% state blend (lowest MAE 4.810) both did better than the carrier's own EWMA (7.236) and its own three year mean (7.408).
- We tested requested rates, and they led nowhere. A carrier's requested rate adds nothing to next year prediction (ΔRMSE +0.013 percentage points). And the gap between what was requested and what was approved has about zero correlation with the following year.
- We chose the five year default (the six year state average) on purpose, as a middle option. It is not an optimum that has been tested. We haven't finished a direct test against EWMA on CMS state filings and AHRQ MEPS-IC, and any results will be included in a later update.
- Modeled Taft-Hartley (Benefitra modeling assumption). The plan renewal for 2027 is confirmed at 18%, and the starting rates the calculator uses for 2027 already reflect it. Starting in 2028 we use 8.0% a year as a near term modeling assumption and 7.5% (six year view).
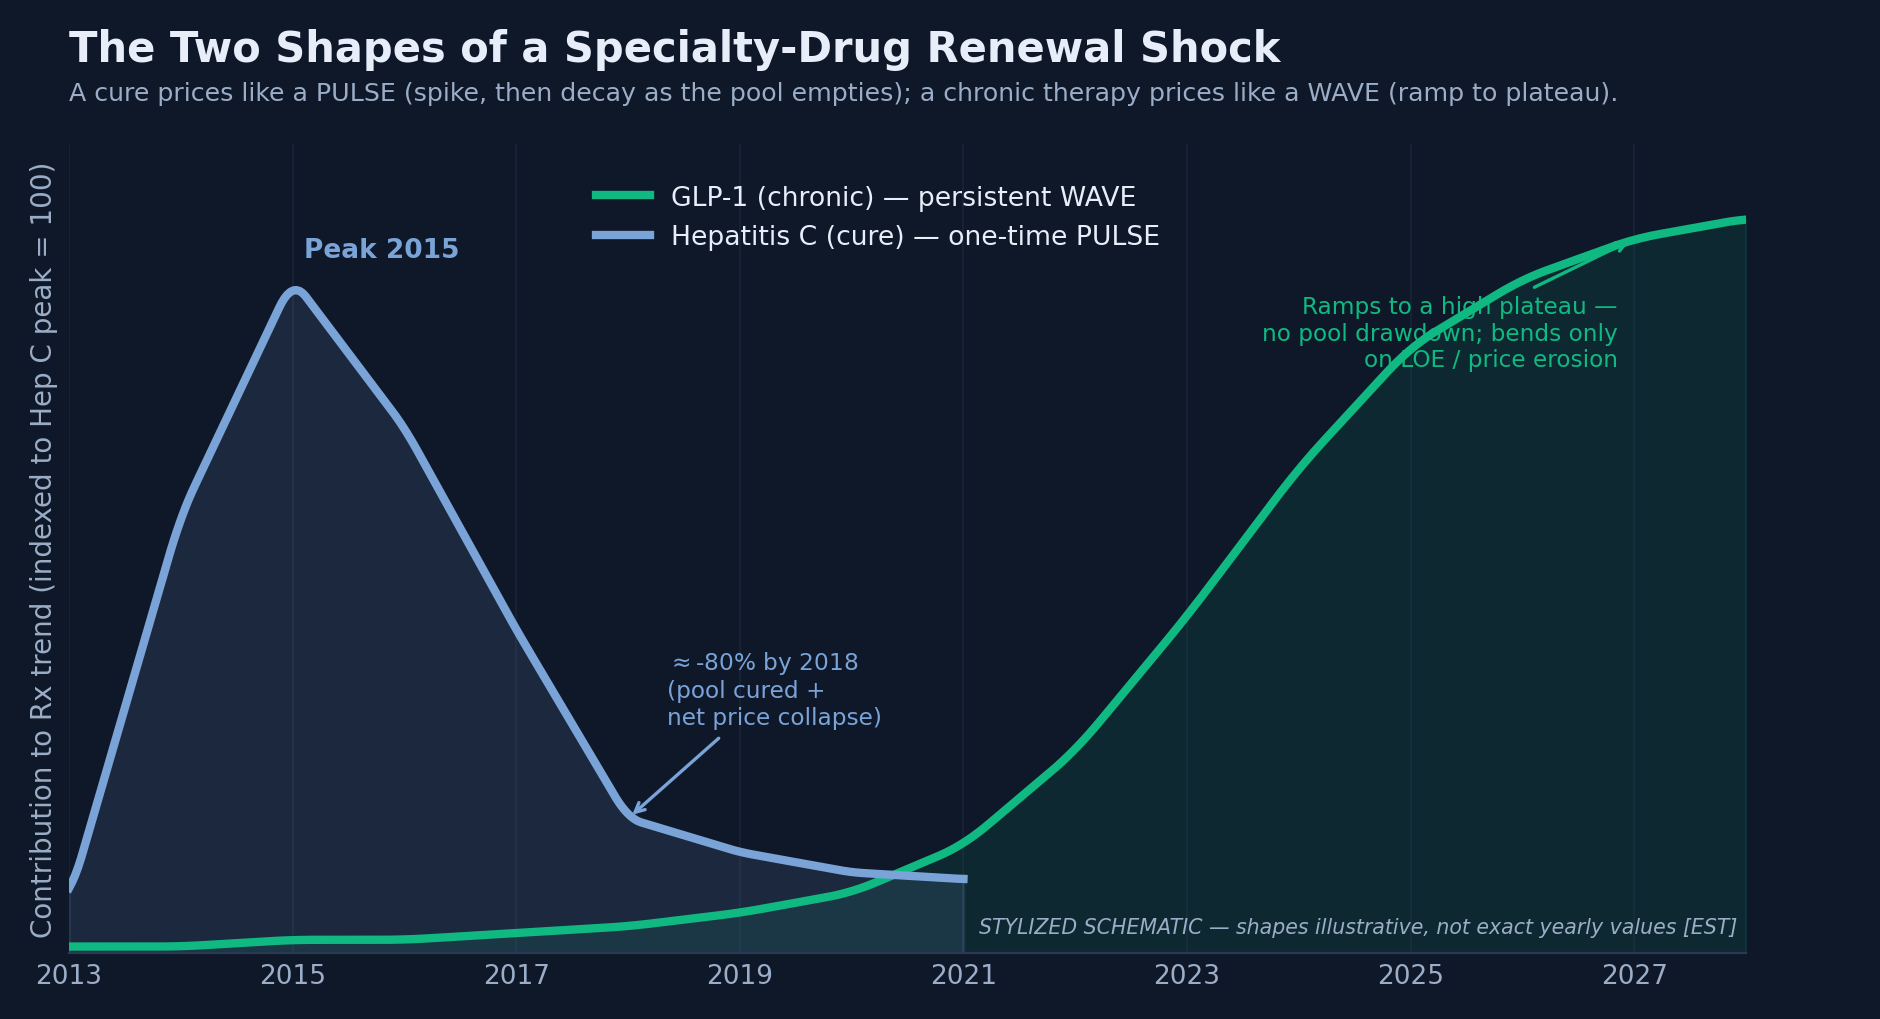
- Specialty drugs change the shape of cost trend. A cure (Hepatitis C) acts like a one time pulse, while a chronic therapy (GLP-1) acts more like a wave that lasts. Could the prescription drug pipeline work as an early renewal signal? It's a hypothesis, and we haven't tested it yet.
- We still have to rerun the funding path sensitivity test (Section 9) using the 2027 Taft-Hartley assumptions and the 2021 to 2026 state averages. The earlier results are withdrawn. This edition has no new ones.
Disclosures
Conflict of interest. Benefitra is a licensed insurance brokerage, which means we may receive commissions or fees when our clients buy coverage. We sell and advise on PEO, Taft-Hartley and captive arrangements, among others. This research was paid for by Benefitra.
Not a quote or opinion. The Benefitra Renewal Index is a statistical estimate, and it is built from public state rate filings. It is not a quote, it is not a guarantee of any renewal rate or outcome, and it is not an actuarial opinion either. Your renewal will depend on your carrier, health plan, group and state. If a filed rate exists, that filed rate beats the Index.
AI use. AI tools helped us with the analysis and drafting (Grok by xAI for research and drafting, and Claude by Anthropic for quality control and editing). Sam Newland, CFP®, went through and checked every figure before publication.
Contents
- Why renewal prediction is hard. Trend versus realized growth, and filed versus experience rated.
- The landscape of renewal signals. What predicts a small group and a large group renewal.
- Five year outlook. The "GDP + excess" glide.
- What a rate filing tells you. Read the filed rate, and one dead end.
- Which lookback predicts most accurately in backtests? We look at a national series, CMS state and issuer panels, and the Index. The subsections cover 5A carrier versus state, 5B requested rates as a dead end, 5C the Taft-Hartley plan, 5D state small group averages from 2021 to 2026, and 5E the Benefitra Renewal Index.
- Specialty drugs. Pulse versus wave.
- A proposed composite. Standard trend plus one overlay (untested).
- Recommended architecture. How the pieces fit.
- Does the renewal assumption change the funding recommendation? Withdrawn pending a rerun.
- Methods and data sources.
- Limitations.
- Data, citation and corrections. Downloads, how to cite, changelog and errata.
- References.
1 Why renewal prediction is hard
What data can actually answer the question boils down to two main differences.
Renewals look simple. It's just one number, the percentage by which next year's health insurance premium beats this year's. But in reality it comes at the end of a long chain, fed by unit price, utilization, service mix, plan design, demographics, area cost, carrier margin and regulation. Each of those links shows up in different data, and the data you end up using depends on how the group is rated.
Forward trend versus realized premium growth
Medical cost trend is the forward number that carriers price on, with benefits held constant, and surveys like PwC's forecast it.1 Realized premium growth is something different. It is what employers actually paid after plan design changes were made, and KFF measures it.2 Realized growth tends to run below cost trend because employers buy down their health benefits. That is why you should use trend to make the prediction and then use realized growth to check the model against what employers actually paid. And only ever compare the two for the same year.
Small group is rate filed and large group is experience rated
Small group business is community rated. Carriers file their rates for the next year with the state months in advance.9, 10 So you don't have to forecast the price, because you can read it. Large group business is experience rated, and nothing is filed publicly. That leaves you with only two signals to work from, which are surveys and the group's own claims. (Federal rate review only covers the individual and small group markets.12)
Where the small group line sits
Federal rules define the small group market as employers with 1 to 50 employees. States are allowed to stretch that to 100, and California, New York and Vermont actually do that. Premiums inside this market can vary based only on age, area, tobacco use and family size. They never vary according to health status. New York and Vermont take it even further and do not allow age rating at all. There's also the Applicable Large Employer threshold of 50 full time equivalent employees. This threshold controls the employer mandate but does not control the rating method. So a group could be an ALE for the mandate and still be community rated in a 1 to 100 state. When it comes to renewal prediction, there is one important question to ask. Is this group's price filed and readable, or is it experience rated and negotiated?
2 The landscape of renewal signals
By segment, here is what really tells you what next year's renewal will be.
Lots of organizations publish a medical trend, a cost index or a premium survey. But they are not all equally useful when you are trying to predict a renewal. Below, we cite vendor surveys as single context figures with dates. We do not reproduce their tables.
The three figures don't measure the same thing. PwC's is a forward medical cost trend for 2027. KFF's is what employers paid in 2025. Altarum's cover economy wide health prices and usage as of mid 2026. Not one of them is a renewal forecast for a specific group.
Small group signals, ranked
| # | Source | Why it ranks here |
|---|---|---|
| 1 | State ACA small group rate filings (SERFF and CMS rate review data) | The filed price change, per carrier and state. Read it.9, 10 |
| 2 | State filed history (the Benefitra Renewal Index) | Gap fill when a filing is missing. Backtested in Section 5. |
| 3 | National forward trend surveys (PwC, Segal and others) | Directional national context only.1, 15 |
| 4 | KFF realized premiums | For calibration, not prediction.2 |
| Not ranked | Weak. CPI medical care, index levels | Lagging and noisy for a next year renewal. |
Large group signals
Large groups have no public filings. What you can use is mainly the group's own claims experience, plus national medical trend surveys for context and public area cost proxies such as BLS metro price series and CMS geographic cost indices. We don't publish a large group forecasting model in this paper. A sound one would take licensed inputs, or else a rebuild on free sources like MEPS-IC and CMS National Health Expenditure data.5, 18
3 Five year outlook
Over many years, a forecast is a decomposition and not an index.
Health economists split nominal medical trend into inflation, real income growth and "excess" growth, and over the long run they force it toward the growth of the economy.
excess growth = growth in health care's share of GDP
Why does this matter? Healthcare spending cannot grow faster than the economy forever. So a credible five year forecast takes a hot near term rate and bends it downward, rather than extending it.
Public long run instruments
| Model | Horizon | Current read |
|---|---|---|
| CMS National Health Expenditure projections5 | 2025 to 2034 | NHE grows 5.4% a year against GDP at 4.1%, and the health share of GDP rises from 18.0% (2024) to 20.6% (2034). Private health insurance spending grows 8.2% in 2025, 6.3% in 2026, about 4.6% a year in 2027 and 2028, and 4.4% a year in 2029 to 2034 (aggregate, not per enrollee). |
| Getzen / SOA long run model7 | 10+ years | Long run medical cost increases of about 5.0% a year, declining toward per capita income growth. |
| CBO budget and long term outlooks6 | 10 to 30 years | "Excess cost growth" wedge, declining over time. Not reverified. |
| Altarum HSEI8 | Monthly | National health spending up 5.8% (June 2026). Health Care Price Index up 2.6% (July 2026). |
Remember that the CMS private health insurance figures are aggregates, and shifts in enrollment keep them down. Growth per enrollee (the renewal concept) is higher, so think of the aggregate as a floor.
A five year glide
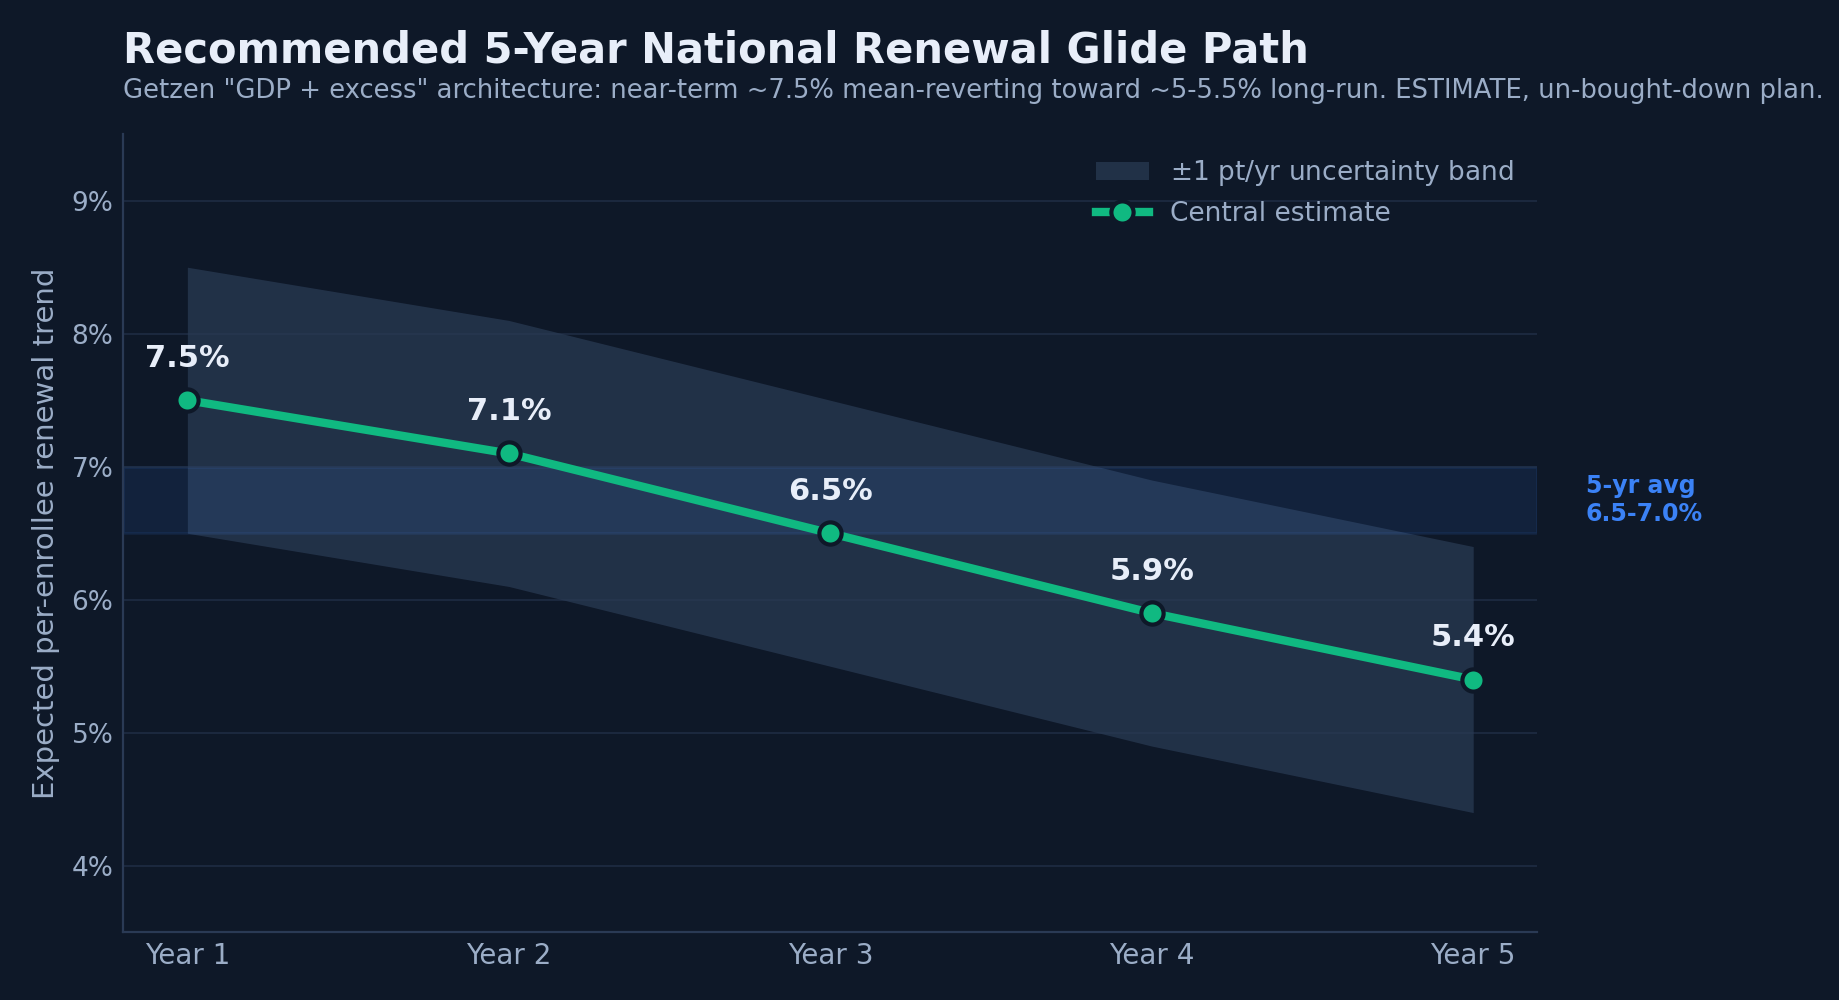
Our five year recipe has four steps. First, we anchor the long run at the Getzen figure of about 5.0%. Next, we set years 1 and 2 at about 7 to 8% per member and glide between them. Last, we flex by state by plus or minus 1 to 1.5 points. The near term 7 to 8% is a Benefitra planning estimate, and we have not tied it to any one public source. On average, the five points in Figure 1 come to 6.5% a year.
4 What a rate filing tells you
In small group, the filed rate answers the question for the year that it covers. The filing does not forecast any later year.
Each year, individual and small group carriers file their rate changes through the federal rate review process.9, 10 Review kicks in at an increase of 15% or more, or one above a state specific threshold.11 Large group generally doesn't go through federal rate review.12
Requested rates did not help
Does a carrier's requested rate help predict that carrier's rate change the next year? What about the gap between what carriers ask for and what actually gets approved? We checked both of these using the CMS rate review files for plan years 2014 through 2026 (Section 5B).21 It turns out that neither one helps. The requested rate does not add anything to next year prediction (ΔRMSE +0.013 percentage points, n = 4,473). As for the gap between the requested and the approved rate, it has close to zero correlation with the year that follows. We haven't looked at whether that gap matters in prior approval states. The regulator modified field appears only in the files from 2014 to 2019 and covers about 3% of issuer years.
If you have the approved rate, it's the better anchor for a small group block. It isn't in the CMS public files after 2019, though, so you have to get it from RateReview.HealthCare.gov or the state insurance department.10 One context point on the individual market (not group). Peterson-KFF found a median proposed 2026 increase of 18% across 312 Marketplace insurers.13
Hard limits of filing data
None of this applies to large group, which has no filing. And a block average change isn't what any one group sees. A model also has to respect the as of date of each forecast, so later information can't leak into it.
5 Backtests of which lookback predicts most accurately
If all you have is past data, which rule holds up when you test it on new data?
Every model needs a base rule for when there is no filing. If all you have is recent history, what gives the most accurate forecast of next year? We tested this first on a national series and then on the CMS rate filing panel. The evidence from the CMS panel is stronger.
The national series and its data problem
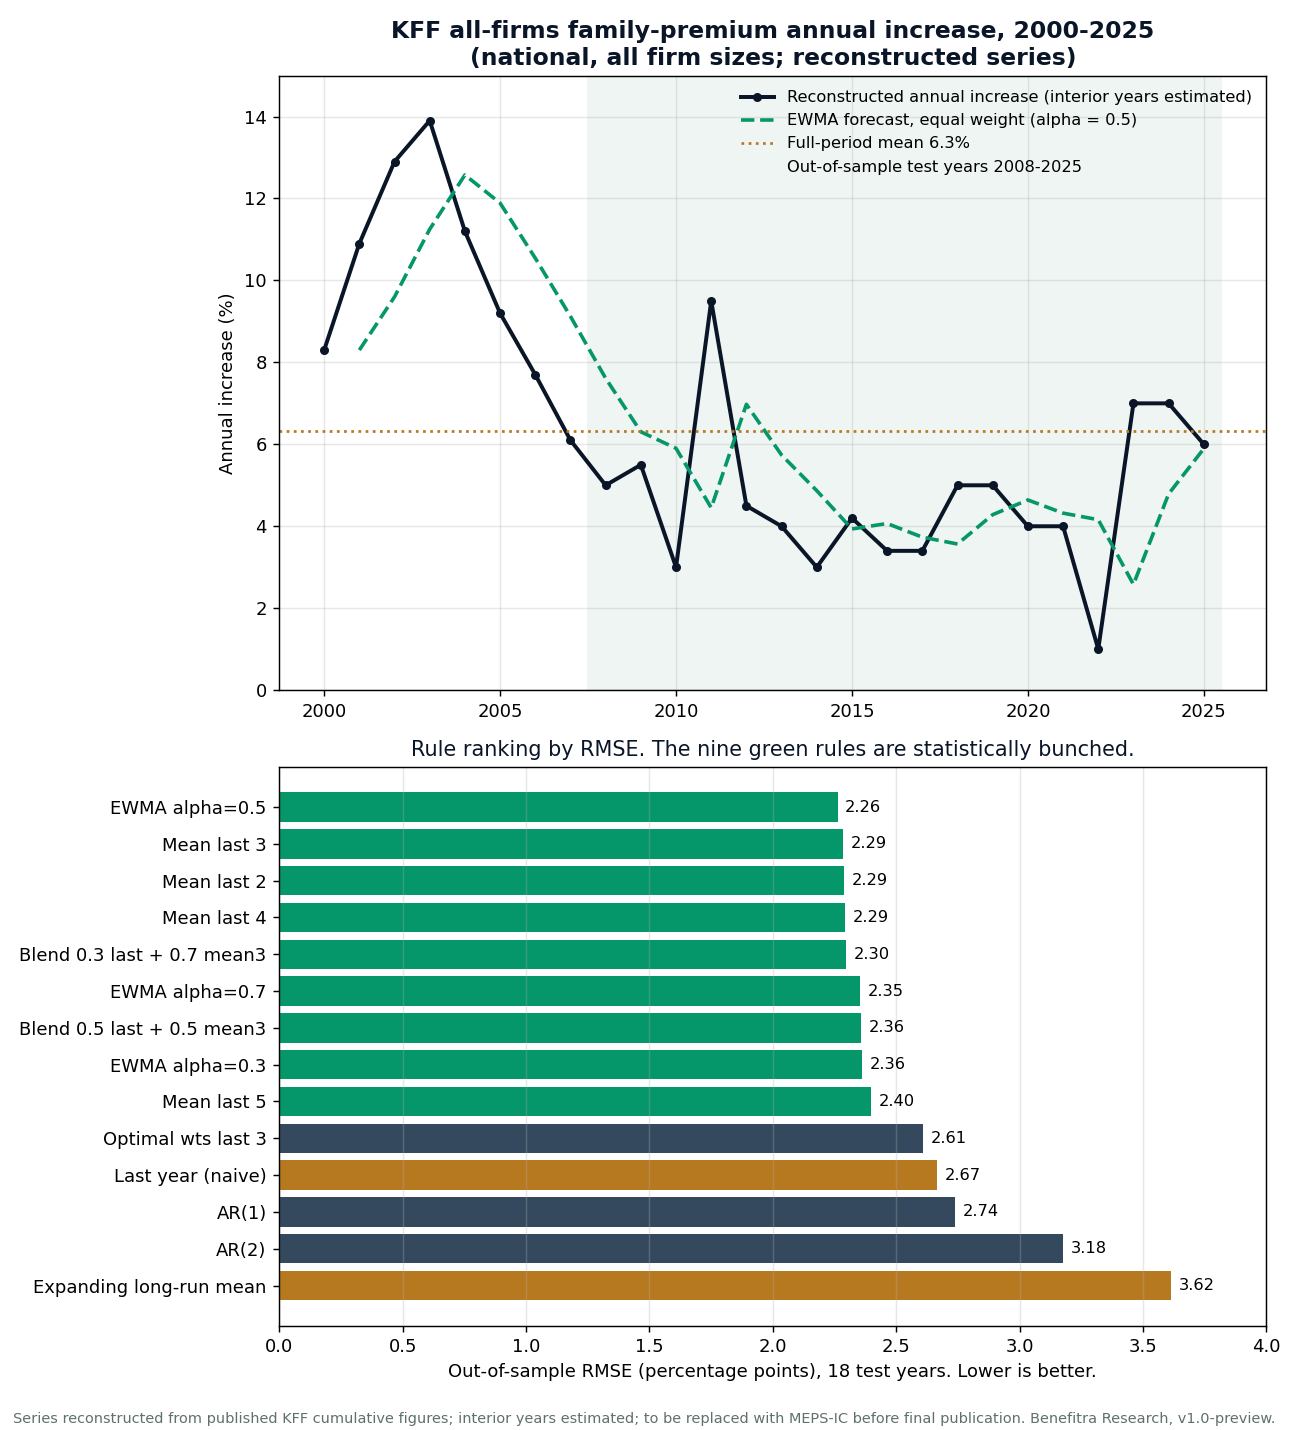
For our national test we used the KFF Employer Health Benefits Survey data on the all firms family premium annual increase, from 2000 to 2025 (a total of 26 observations). This series was rebuilt using published KFF cumulative figures, and the interior years are estimates. We have left the swap to MEPS-IC data for a later update. Until that happens, the national results in this edition rely on the reconstructed series.18 In an earlier draft, an AI model filled in those interior years with values it had recalled. We do not present those as data. The only values we have confirmed against KFF's own pages are recent ones. They show +7% for 2024 and +6% for 2025.2, 3
We ran a spot check. Over roughly five year windows (the first one, 1999 to 2005, spans six years), we compared the growth implied by the reconstructed series with KFF's published average family premiums (KFF 2025 survey, Figure 1.12, and its stated five and ten year growth).2
| Window | KFF published | KFF growth | Reconstructed series | Gap (pts) |
|---|---|---|---|---|
| 1999→2005 | $5,809 → $10,962 | +88.7% | +87.5% | -1.2 |
| 2005→2010 | $10,962 → $13,890 | +26.7% | +30.4% | +3.7 |
| 2010→2015 | $13,890 → $17,680 | +27.3% | +27.8% | +0.5 |
| 2015→2020 | $17,680 → $21,419 | +21.1% | +22.3% | +1.2 |
| 2020→2025 | $21,419 → $26,993 (KFF text says +26%) | +26.0% | +27.5% | +1.5 |
In four out of the five windows, the reconstructed series lands within about 1.5 points of the totals KFF published. In 2005 to 2010 it runs 3.7 points high. Is that close enough to give a rough test of how the rules rank? Yes. Is it close enough that we could publish the series as data? No, and so we don't publish it.
Method
For each test year from 2008 to 2025 (that's 18 years), each rule gets fit only on data from the years before and then it has to predict that year. Because of that, the number of training points grows from 8 to 25 as we work our way through the years. Each rule got scored on root mean square error (RMSE, where big misses count more) and also on mean absolute error (MAE). In total there were 14 rules that we looked at. These included naive last year, moving averages, exponential smoothers (EWMA), fitted autoregressions and the long run mean. Keep in mind that this is a retrospective backtest. We have not yet frozen a forecast and scored it prospectively.
Throughout this paper the EWMA uses equal weight (α = 0.5). The estimate for next year = 0.5 × the latest year + 0.5 × the previous estimate. That means past years get successive weights of 0.5, 0.25, 0.125 and so on.
| # | Rule | RMSE | MAE | Note |
|---|---|---|---|---|
| 1 | EWMA, α = 0.5 | 2.263 | 1.762 | Lowest RMSE |
| 2 | Mean of last 3 | 2.286 | 1.824 | Tied |
| 3 | Mean of last 2 | 2.288 | 1.786 | Tied |
| 4 | Mean of last 4 | 2.293 | 1.888 | Tied |
| 5 | Blend 0.3·last + 0.7·mean of 3 | 2.297 | 1.755 | Tied |
| 6 | EWMA, α = 0.7 | 2.354 | 1.730 | |
| 7 | Blend 0.5·last + 0.5·mean of 3 | 2.357 | 1.709 | Lowest MAE |
| 8 | EWMA, α = 0.3 | 2.361 | 2.005 | |
| 9 | Mean of last 5 | 2.399 | 2.007 | |
| 10 | Optimal weights on last 3 (expanding fit) | 2.610 | 1.976 | Overfits |
| 11 | Last year (naive) | 2.665 | 1.761 | Ties EWMA on MAE |
| 12 | AR(1) regression | 2.738 | 1.971 | Overfits |
| 13 | AR(2) regression | 3.178 | 2.233 | Overfits |
| 14 | Expanding long run mean | 3.615 | 3.180 | Worst here |
One more, for reference. On the same test, the mean of the last 6 years gets RMSE 2.54 and MAE 2.12. It was not part of the original 14 rule set.
What the national test does and does not show
Lowest RMSE only. EWMA 0.5 did have the lowest RMSE. MAE is another story. Naive last year tied it (1.761 vs 1.762), and three other rules beat it, the 0.5 / 0.5 blend (1.709), EWMA α = 0.7 (1.730) and the 0.3 / 0.7 blend (1.755).
Not statistically significant against naive. If you run a Diebold Mariano test on squared errors, you get t ≈ -1.15 on 18 points. If you take out the 2011 spike and its 2012 rebound, the two rules score the same (RMSE 1.945 vs 1.946).
The supportable claim is modest. On this series, reasonable smoothing does at least as well as naive last year and a lot better than the long run mean. Part of why the long run mean does so badly is a regime effect, because the double digit years of 2000 to 2005 stay in its window.
Proxy. The all firms family premium leans toward large and self funded employers. It is not a small group book.
BASE RULE Base rule for the time series. If there is no filing, forecast next year with an EWMA at α = 0.5 on the state small group series. That gives equal weight to the latest year and to the prior estimate. A mean of the last two or three years works about as well. What you should not do is carry a single year forward without smoothing it.
Lookback window for the five year horizon
Five year paths raise a different question. If you want to predict the average over the next five years, how many years of history should you average? The draft pushed the national series back to 1988 (KFF/KPMG HIAA, with values before 2000 estimated and 1989 to 1998 at low confidence) and it tested windows of 1 to 20 years. The same data caveat applies here, and even more strongly.22
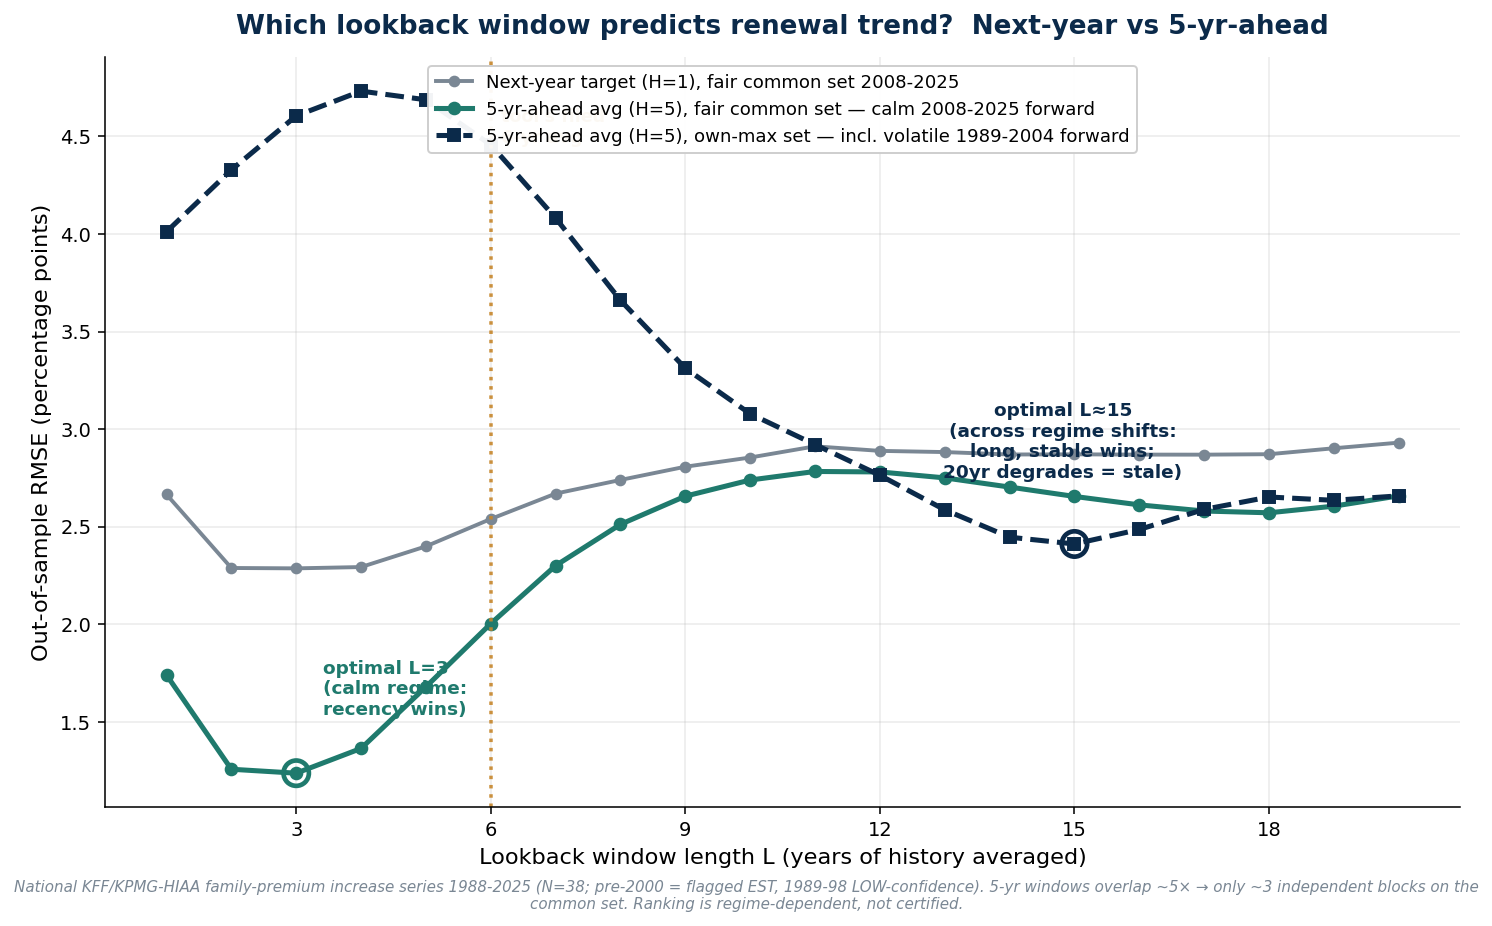
Three things stand out in the numbers.
Recent calm period (2008 to 2025 origins). The three year window had the lowest error (RMSE about 1.24). The six year window scored 2.00, and the 20 year window scored 2.66.
Longer set including the 1990s and early 2000s. Here the error rises from about 4.0 at one year to about 4.7 at four years. After that it falls to a low of 2.41 at 15 years and climbs again to 2.66 at 20 years. The six year window scored 4.46. That makes it worse than the two year window (4.33), slightly better than the three year (4.61) and much worse than 15 or 20 years.
No single optimal window. Which window has the lowest error changes sharply from one set to the other. And the test rests on about three independent five year windows plus estimated values before 2000. It doesn't identify an optimum. It doesn't validate the six year choice either.
The five year default
For the five year default we use the six year state average. We chose it deliberately as a middle option, and it is not an optimum we have tested. We have not finished a direct test against EWMA on CMS state filings and AHRQ MEPS-IC, and any results will appear in a later update. The national test above has LOW confidence (about 3 independent windows, with values before 2000 estimated), and it does not single out one optimal window. To fill next year gaps, we're staying with the equal weight EWMA.
5A. Carrier versus state when one carrier's filing is missing
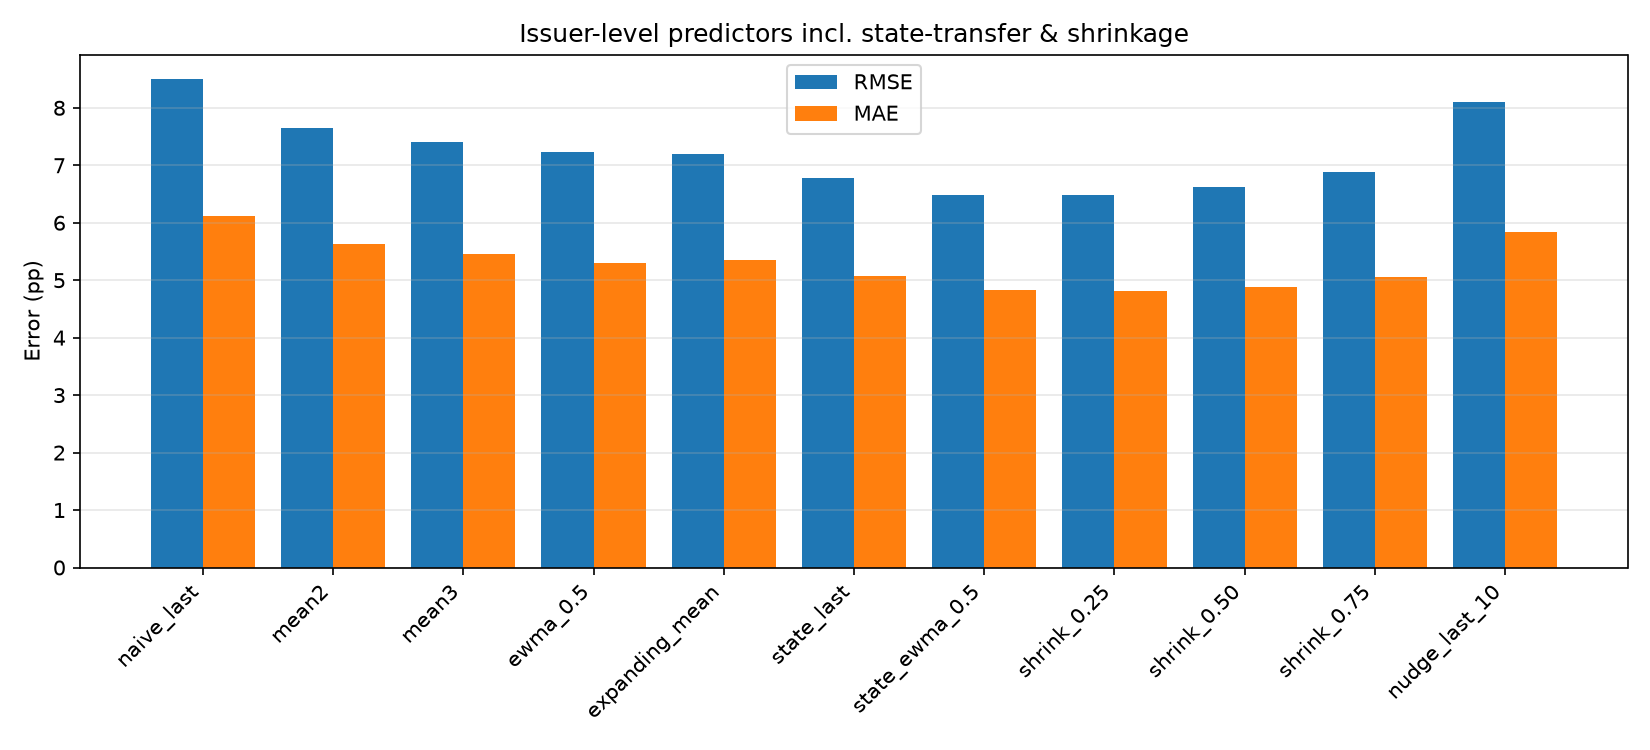
Here is the practical question. If one carrier's filing is missing, should you fill it from that carrier's own history, or from the smoothed path of the state? We tested both approaches on the CMS rate review panel.20
Data. CMS Single Risk Pool Rate Review Public Use Files, Worksheet II, plan years 2014 to 2026, small group only.9 Where there is a regulator modified rate, we use that one. If there isn't one, we fall back to the submitted rate, then the product rate, then the cumulative change. We drop changes of more than 50 points. Issuers need at least three years to stay in, and everything is weighted by enrollment. In total that covers 50 states and DC. There are 630 issuers, 5,987 eligible issuer years, 3,964 issuer test observations and 454 state test observations. The test years run from 2018 to 2026, and each rule is fit using only the years that came before it. For the most part the outcome is the submitted rate. Of the 6,268 raw issuer years, 3,066 used the submitted field and 2,979 used the product field. Another 213 used the regulator modified field, and 10 used the cumulative field.
State grain
| Rule | RMSE (pp) | MAE (pp) |
|---|---|---|
| EWMA α = 0.5 | 4.391 | 3.304 |
| EWMA α = 0.3 | 4.430 | 3.368 |
| Mean of last 3 | 4.479 | 3.368 |
| Mean of last 6 | 4.484 | 3.441 |
| Mean of last 5 | 4.485 | 3.413 |
| EWMA α = 0.7 | 4.555 | 3.404 |
| Expanding long run mean | 4.628 | 3.579 |
| Mean of last 2 | 4.656 | 3.428 |
| Last year (naive) | 5.008 | 3.743 |
The top rules are close together (4.39 to 4.56). Naive last year stands out as clearly the worst.
Issuer grain
| Rule | RMSE (pp) | MAE (pp) |
|---|---|---|
| State EWMA α = 0.5 | 6.484 | 4.822 |
| Blend 25% carrier / 75% state | 6.488 | 4.810 |
| State mean of last 3 | 6.562 | 4.872 |
| Blend 50% / 50% | 6.621 | 4.890 |
| State last year | 6.778 | 5.075 |
| Blend 75% carrier / 25% state | 6.875 | 5.060 |
| Carrier EWMA α = 0.3 | 7.063 | 5.218 |
| Carrier mean of last 6 | 7.175 | 5.300 |
| Carrier expanding long run mean | 7.191 | 5.355 |
| Carrier EWMA α = 0.5 | 7.236 | 5.305 |
| Carrier mean of last 3 | 7.408 | 5.448 |
| Carrier mean of last 2 | 7.649 | 5.632 |
| Carrier last year, nudged 20% to mean | 7.721 | 5.590 |
| Carrier last year (naive) | 8.503 | 6.117 |
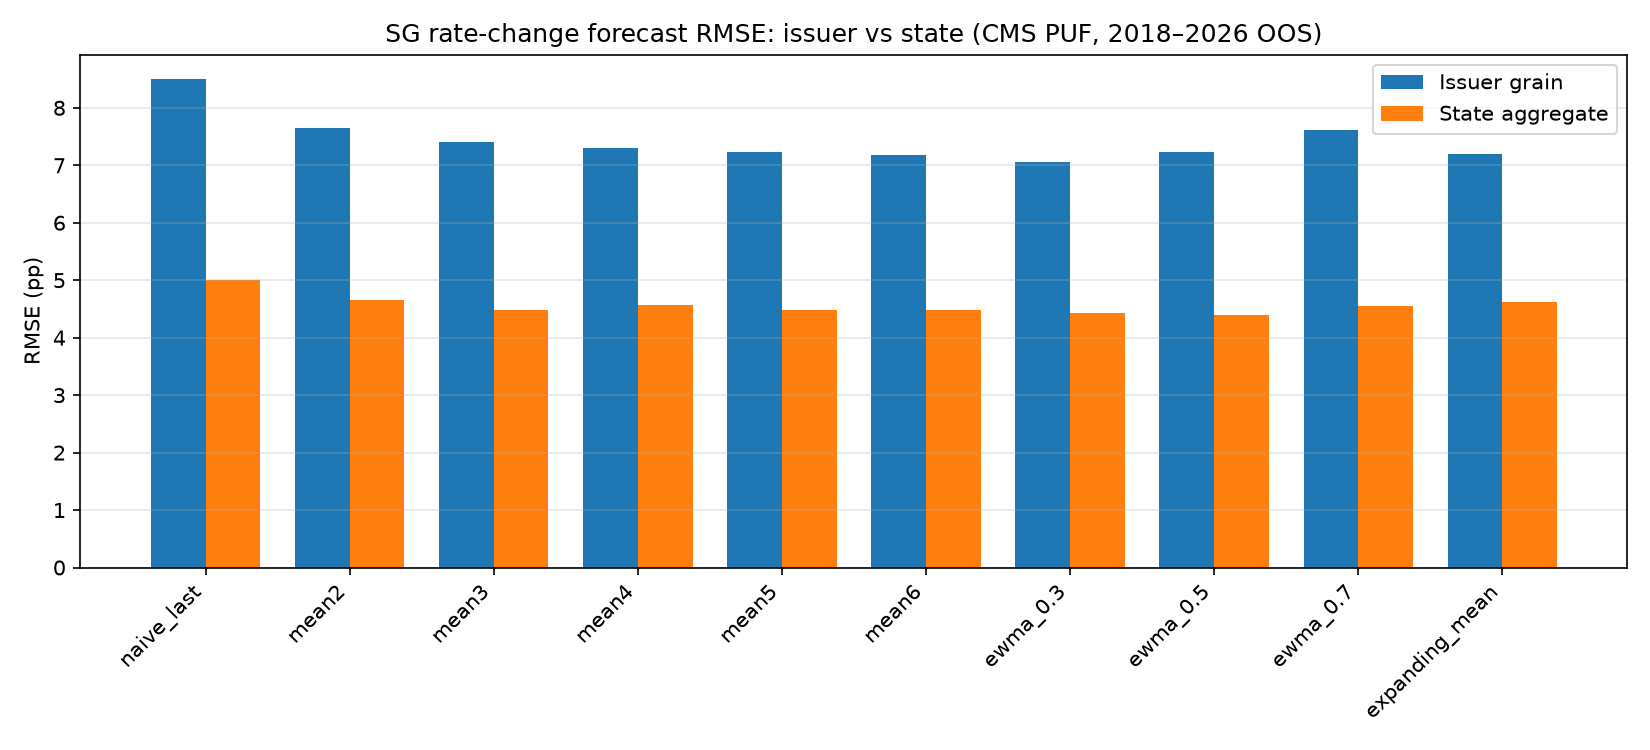
The rules that were based on the state came out ahead of every one of the carrier's own rules. Compared with the carrier's own EWMA and its three year mean, the margin was 0.75 to 0.92 RMSE points. The two leaders differ by less than 0.01 and are effectively tied. There is one result, though, that goes against the national test. At the issuer grain, the carrier's own long run mean (7.191) and six year mean (7.175) both did better than the carrier's own short EWMA (7.236). Carrier histories are noisy enough that the longer averages help. That's why we don't say "never use a long run mean". What we say is "prefer the state path".
Why the state wins
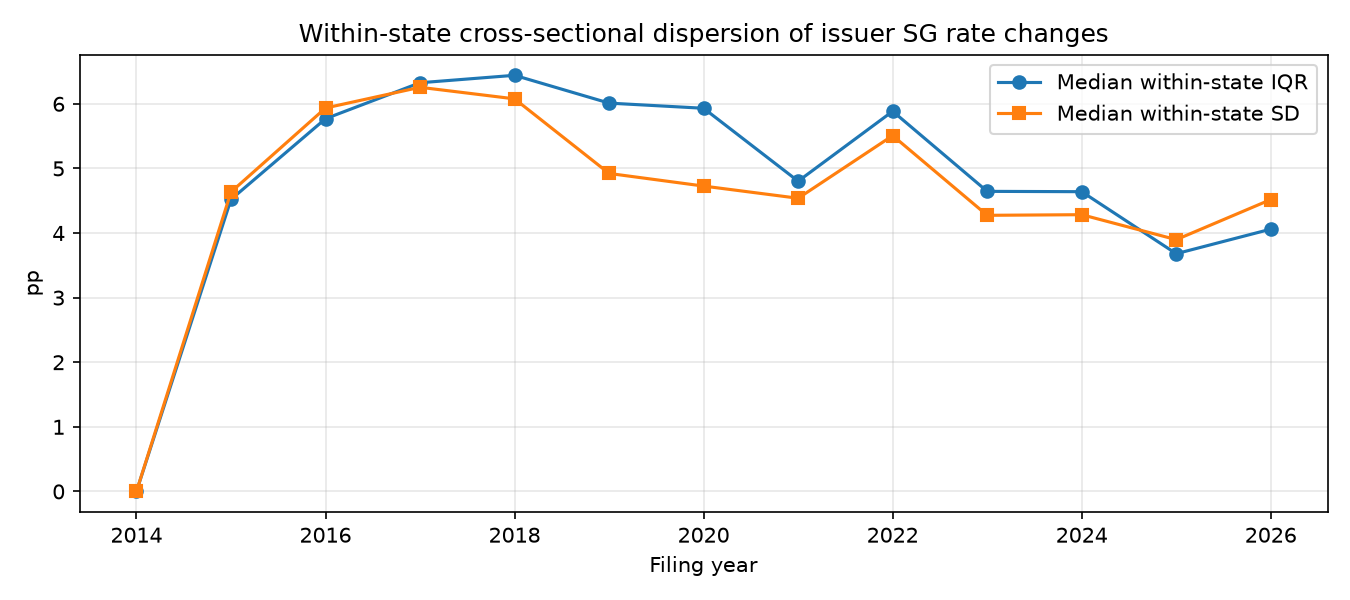
From one year to the next, carrier series barely persist (the AR(1) coefficient is about 0.15, compared with about 0.27 for state series). That is why it helps to borrow strength from the state. Even within the same state, insurance carriers differ a lot. Across state years that had two or more carriers (n = 652), the median spread between the 25th and 75th percentile carrier was 4.93 points. In 8 of 9 test years, the state rule with the lowest error was not the same as the issuer rule with the lowest error. So no, the state average can't take the place of a carrier's filing. It is just the better default to use when that filing is missing.
METHOD RULE Method rule for small group gap fill. If there is a filing, read it. If you have the approved or final rate, use that one first. If there is no filing, use the state EWMA (α = 0.5) or the 25% carrier / 75% state blend. Don't rely on the carrier's own last two or three years alone. And don't just carry naive last year forward, because it did worst at both grains. By default, five year paths use the state's six year filed average (Section 5D). We picked it on purpose as a middle option, and it has not been tested as an optimum.
5B. Requested rates, a dead end we tested
These are the same CMS rate review files, but the sample is wider than in Table 6 (n = 4,473 against n = 3,964). So the baseline here is different from Table 6.21 We added the carrier's requested rate for year t to a regression on the state EWMA. That improved t+1 RMSE by 0.013 points (6.686 to 6.673, n = 4,473), which is well below a usefulness bar of 0.05 points. At t+2 it made things slightly worse (-0.004, n = 3,876). If you carry the requested rate forward on its own, it scores an RMSE of 8.722 at t+1, which is far worse than carrying the state EWMA forward (6.756). The correlation with the next year was 0.20 for the state EWMA and 0.14 for the requested rate. For the gap between requested and approved, it was about 0.00. The regulator modified field only exists in the files from 2014 to 2019. So any claim about prior approval states is still untested.
So the bottom line is that the requested rate adds nothing to next year prediction. To fill next year gaps, use the state EWMA or the 25/75 blend.
5C. Modeled Taft-Hartley (Benefitra modeling assumption)
The Taft-Hartley plan is a national multi employer medical plan on the BCBS PPO network. Its trust sets its pricing. That makes the state small group filed averages in Section 5D the wrong input for it, so Benefitra models it on its own path.24 To see how these plans work for employers, read Taft-Hartley plans for small employers.
Conflict of interest. Benefitra sells and advises on the Taft-Hartley plan. Except for the confirmed 2027 renewal, everything in this block is a modeling assumption that Benefitra made for our simulator. It is not a quote, and it is not a promise of future renewals.
That 1.5 point SD is the forecast uncertainty used in the simulation, and it is wider than the spread of the path itself (about 0.5).
In the stress case we add about 2 points a year to the path from 2028 onward. The averages come out to around 10.0% over three years and 9.5% over five years.
This is for comparison only, and it isn't like for like because the plan is national. 7.5% is higher than 27 of the 51 state six year averages in Section 5D (median 7.36%). And 8.0% is higher than 15 of the 51 state three year averages (median 9.42%).
5D. State small group averages, 2021 to 2026
These are small group filed rate changes by state, weighted by enrollment, taken from the CMS rate review files.9, 23 The state fully insured defaults in the simulator should use this vintage of six year averages.
Read these with care. Many of the recent cells are submitted changes and not approved or final ones. There is no 2027 approved file yet, so do not label 2026 submitted figures as 2027 approved. This is small group data only. It is not a guide for groups over 50 (or over 100 in CA, NY and VT).
| # | State | Six year avg 2021 to 2026 | Three year avg 2024 to 2026 | EWMA 0.5 | 2026 only |
|---|---|---|---|---|---|
| 1 | KY | 11.85 | 15.42 | 15.39 | 17.50 |
| 2 | OH | 10.17 | 14.59 | 14.98 | 19.82 |
| 3 | MO | 10.11 | 9.42 | 11.01 | 13.74 |
| 4 | GA | 9.61 | 7.99 | 7.48 | 6.23 |
| 5 | NJ | 9.42 | 11.45 | 12.45 | 15.45 |
| 6 | NY | 9.36 | 10.24 | 11.13 | 13.03 |
| 7 | NM | 9.08 | 10.85 | 12.46 | 16.77 |
| 8 | VT | 9.06 | 10.83 | 8.11 | 3.36 |
| 9 | CT | 9.01 | 9.42 | 10.01 | 10.76 |
| 10 | KS | 8.93 | 11.07 | 10.43 | 8.61 |
| 11 | AZ | 8.32 | 9.71 | 11.88 | 17.27 |
| 12 | ID | 8.29 | 9.28 | 10.31 | 12.87 |
| 13 | ME | 8.12 | 13.93 | 13.34 | 17.77 |
| 14 | NE | 7.86 | 11.88 | 12.38 | 16.75 |
| 15 | NV | 7.85 | 9.68 | 10.61 | 13.39 |
| 16 | WI | 7.72 | 9.31 | 10.07 | 12.96 |
| 17 | WV | 7.72 | 10.50 | 11.53 | 15.94 |
| 18 | MA | 7.67 | 7.80 | 8.81 | 10.61 |
| 19 | TX | 7.66 | 10.00 | 11.27 | 15.51 |
| 20 | WA | 7.61 | 10.80 | 10.93 | 12.66 |
| 21 | OR | 7.60 | 11.00 | 11.04 | 12.72 |
| 22 | OK | 7.60 | 9.82 | 11.24 | 15.14 |
| 23 | TN | 7.56 | 9.99 | 10.25 | 12.29 |
| 24 | IL | 7.56 | 9.68 | 10.36 | 13.37 |
| 25 | IN | 7.39 | 7.43 | 7.37 | 7.05 |
| 26 | CO | 7.36 | 9.59 | 10.11 | 12.89 |
| 27 | MN | 7.36 | 10.74 | 11.40 | 14.44 |
| 28 | UT | 7.15 | 9.01 | 8.54 | 9.26 |
| 29 | MI | 7.15 | 9.80 | 9.85 | 11.06 |
| 30 | MT | 7.12 | 8.97 | 9.82 | 12.28 |
| 31 | LA | 7.12 | 9.06 | 8.92 | 10.06 |
| 32 | RI | 7.11 | 10.52 | 11.87 | 15.41 |
| 33 | DC | 6.95 | 7.98 | 8.40 | 9.86 |
| 34 | FL | 6.82 | 9.44 | 9.71 | 11.71 |
| 35 | NH | 6.54 | 8.02 | 8.63 | 10.70 |
| 36 | VA | 6.53 | 8.42 | 8.85 | 11.04 |
| 37 | PA | 6.45 | 7.67 | 9.21 | 13.20 |
| 38 | NC | 6.43 | 9.05 | 10.86 | 16.71 |
| 39 | SC | 6.00 | 8.32 | 8.62 | 11.02 |
| 40 | ND | 5.81 | 7.86 | 7.71 | 6.20 |
| 41 | DE | 5.49 | 10.26 | 12.04 | 19.19 |
| 42 | AL | 5.48 | 6.62 | 7.31 | 9.50 |
| 43 | CA | 5.44 | 7.54 | 7.24 | 8.08 |
| 44 | MD | 5.38 | 5.56 | 5.30 | 5.01 |
| 45 | WY | 5.28 | 4.33 | 4.49 | 2.19 |
| 46 | AR | 5.08 | 8.34 | 8.42 | 9.58 |
| 47 | AK | 4.58 | 5.08 | 2.68 | -4.20 |
| 48 | HI | 4.56 | 7.11 | 7.80 | 10.48 |
| 49 | SD | 4.19 | 4.17 | 4.22 | 4.41 |
| 50 | IA | 3.98 | 4.77 | 6.00 | 8.25 |
| 51 | MS | 3.36 | 4.94 | 8.44 | 14.60 |
The median six year average comes to 7.36%, and the median three year average to 9.42%. Most states saw the last three years run hotter than their six year average.
5E. The Benefitra Renewal Index
The method that the backtests pick is what we call the Benefitra Renewal Index. It is an open rule for estimating a small group health insurance renewal when you don't have a live filing at hand. It is not an industry standard.
Open formula
Start with y, a state's enrollment weighted small group filed change. The formula has three parts.
Five year path mean of the last 6 filed years default, not a tested optimum
Carrier gap fill (optional) 0.25 × carrier EWMA + 0.75 × state EWMA
HARD RULES What the Index does and does not do
A filing beats the Index, so use the Index only for gaps and defaults. It covers only small group, because large group has no public filing panel. Requested rates do not help predict later years (Section 5B). Also, it is an estimate, not a guarantee, and not a substitute for underwriting.
How it compares
| Test | Method | RMSE | MAE |
|---|---|---|---|
| National, n = 18 | EWMA α = 0.5 (Index near term) | 2.26 | 1.76 |
| National, n = 18 | Mean of last 3 | 2.29 | 1.82 |
| National, n = 18 | Mean of last 6 | 2.54 | 2.12 |
| National, n = 18 | Naive last year | 2.67 | 1.76 |
| National, n = 18 | Expanding long run mean | 3.62 | 3.18 |
| State, n = 454 | State EWMA α = 0.5 | 4.39 | 3.30 |
| State, n = 454 | Naive last year | 5.01 | 3.74 |
| Carrier, n = 3,964 | State EWMA / 25/75 blend | 6.48 / 6.49 | 4.82 / 4.81 |
| Carrier, n = 3,964 | Carrier expanding mean | 7.19 | 5.36 |
| Carrier, n = 3,964 | Carrier own EWMA α = 0.5 | 7.24 | 5.31 |
| Carrier, n = 3,964 | Carrier naive last year | 8.50 | 6.12 |
We don't score PwC, Segal or other survey trends here. Doing that would require survey forecasts that were locked at the time they were made, and we don't have those. We looked in a 2026-09-18 scan. We did not find any public consulting, filing template or trade group product that publishes this exact open recipe. The closest relatives are the multiyear experience weighting and exponential smoothing methods that appear in actuarial education papers.
IN ONE LINE In one line. The Benefitra Renewal Index is an open, equal weight EWMA on state small group filings for the near term. It adds a six year state average for five year paths, and for missing filings it uses the state path (not the carrier's own history). When there is a filing, we read the filing.
6 Specialty drugs
A new specialty drug causes a shift in cost trend. Its biology tells you what shape that shift will take.
A drug that cures works like a one time pulse. Every patient it treats leaves the eligible pool, and on top of that competition lowers the net price, so spending goes up at first and then comes back down again. A chronic therapy works more like a wave, because patients keep on taking it. Spending keeps climbing until it reaches a plateau, and it only bends with price cuts, patent expiry or tighter eligibility. In a renewal model these two shapes need opposite treatment. If you treat a pulse as a permanent level, you will over price every renewal that comes after it.
Hepatitis C as a pulse
Gilead's Sovaldi was approved in December 2013, and Harvoni followed in October 2014. Spending spiked. Then it fell, as the pool of treatable patients shrank and competing prescription drugs cut net prices. Gilead's own filings describe revenue falling as the number of suitable patients declined. (The year by year figures still have to be pulled again from Gilead 10-K filings.) The lesson? A cure adds a one time loading and then turns into a tailwind.
GLP-1 therapy as a wave
GLP-1 drugs are used long term. The eligible population is large and there's no pool drawdown. IQVIA reports that GIP/GLP-1 agonists contributed $14 billion of US net spending growth in 2025.16 KFF's 2025 employer survey tracks rising GLP-1 coverage among large employers, along with their cost concerns.2 Oral versions, patent expiry and price competition may bend the slope. But they don't shrink the eligible pool.
Early indicators (qualitative)
| Indicator | Visible roughly | Source |
|---|---|---|
| Late stage trial readouts and pipeline | 1 to 3 years ahead | ClinicalTrials.gov, company disclosures |
| FDA approval calendar | months to 1.5 years | FDA novel drug approvals17 |
| PBM annual drug trend reports | 6 to 18 months | Published PBM reports |
| Cure versus chronic, patent expiry dates | structural | FDA labels, Orange and Purple Books |
| Early prescription uptake | 3 to 9 months | Own claims data |
An earlier draft had a chart that rated these signals by "predictive strength". There was no data behind those ratings, so we removed the chart. Does the prescription drug pipeline make renewal forecasts better? That is a hypothesis we have not tested.
A proposed drug loading
The proposed model adds each major drug to the baseline cost trend as its own named, per member loading. That way the pulse can be taken out as it decays. Here's how the steps go. Classify the drug as a cure or as chronic. Then estimate the eligible population. For a cure that is a shrinking stock, and for a chronic therapy it is a growing one. Apply an uptake curve, and then a net price path that steps down when competitors launch and when the patent expires. Finally, divide by expected claims.
We haven't fitted or tested this loading.
7 A proposed composite
Standard trend plus one overlay. It's a design. It isn't a result.
There's no accepted academic index that signals commercial renewals ahead of time. The closest public composites are the CMS NHE projections, Altarum's monthly indicators and the Peterson-KFF tracker.5, 8, 13 We would rather not invent an index. What we propose instead is a standard base with one overlay added on top, picked from three candidates.
A. Pharmacy pipeline overlay (1 and 5 years). The Section 6 drug loading, on top of a base from CMS NHE or from published cost trend surveys.
B. Stop loss and high cost claimant loading (self funded, 1 year). Built from the group's own stop loss quotes.
C. Labor and macro anchor (5 years). It uses BLS health care wage data and hospital prices, and it pulls the long run toward GDP growth.
The overlay weights ought to come from the data rather than being set by hand. And so far, none of these overlays has been fitted or backtested.
8 Recommended architecture
SMALL GROUP Small group next year by state
Start by reading the filings. You can pull them for each carrier and each state from the CMS rate review files and from RateReview.HealthCare.gov.9, 10 Then weight them by covered lives and refresh them every summer. Where there is an approved rate, you anchor on that. And where a carrier filing is missing, you use the state EWMA (α = 0.5) or the 25/75 blend (Section 5A).
LARGE GROUP Large group has no public model in this paper
There are no filings. Start with the group's own claims, and use published national medical cost trend for context along with public area cost proxies. A published large group model has to wait for a rebuild on free data (MEPS-IC, CMS NHE, SOA) or on licensed inputs.
5-YEAR Five year glide and state default
At the national level the glide goes from about 7.5% toward the Getzen long run of about 5.0%, within a ±1 point band (Section 3). By state, the five year default is the six year filed average. We chose it deliberately as a middle option, and it is not a tested optimum (Section 5).
OPTIONAL Optional calibration on placed cases
Where we have them, Benefitra's client renewal files could be used to check the methods against real outcomes. That would take client consent and de identification. This paper uses no client data.
9 Does the renewal assumption change the funding recommendation?
Status of the rerun
We still have to rerun Section 9 on the 2027 Taft-Hartley assumptions. There are no rerun results in this edition. Any results will show up in a later update.
In the earlier run the Taft-Hartley renewal was held at 3% (this is now superseded), and the state averages it used had no stated vintage. Its results have been withdrawn.
Method to be repeated
In the funding simulator, the default fully insured renewal is a filed average for each state. It only reaches community rated groups (up to 50 lives in most states, and 100 in CA, NY and VT). Experience rated groups renew on their own cost trend and do not read it. The test compares two arms across 35 segments ({NY, CA, MA, FL, TX, AL, WY} × {30, 70, 150, 250, 500} lives). One arm uses the per state default. The other uses a flat 6.75% for every state. For each segment, the test records the five year probability that each funding path beats fully insured, and also whether the recommended path changes.
Four points have to be handled in the rerun.
State vintage. Use the 2021 to 2026 averages in Section 5D. They differ from the values used before. NY is 9.36 (was 9.4), MA 7.67 (7.4), TX 7.66 (7.3), FL 6.82 (5.9), AL 5.48 (5.4), WY 5.28 (5.3) and CA 5.44 (5.0). FL now sits above the 6.75% flat index. That reverses its direction compared with the earlier run.
New York. In New York, self funded, level funded or self funded captive arrangements require 101 or more full time equivalent employees. Groups of 100 or fewer are small group in New York and can't use them. Their options are fully insured, PEO, Taft-Hartley and MEWA. So those paths must be excluded for NY 30 and NY 70.
Construction. By design, segments that are experience rated cannot move. The report is going to say how many segments could move at all, and near the 70% threshold it will give exact probabilities.
Conflict of interest. Benefitra sells a number of the alternative paths, and the Taft-Hartley plan is one of them. Any recommendation of a path will come with that disclosure.
Suppose the recommendation stays the same when one input is swapped. That would only show that the recommendation is not sensitive to that input. It would not show that the recommendation is right.
10 Methods and data sources
| Source | Used for | Retrieved |
|---|---|---|
| CMS Single Risk Pool Rate Review PUF, WKSH2, PY2014 to 20269 | Sections 4 and 5A to 5E, Table 7 | 2026-09-18 (Research Desk run) |
| KFF Employer Health Benefits Survey 2025 and 20242, 3 | Realized premiums, Table 3 spot check | 2026-09-27 |
| National family premium series 2000 to 2025 (and 1988 to 1999 extension) | Table 4, Figures 2 and 3 | Not retrieved. Reconstructed from published KFF cumulative figures, with interior years estimated |
| CMS NHE Projections 2025 to 2034 forecast summary5 | Table 2 | 2026-09-27 |
| SOA Getzen model, 2025 update7 | Section 3 | 2026-09-27 |
| Altarum HSEI, August 20268 | Section 2, Table 2 | 2026-09-27 |
| PwC Behind the Numbers 20271 | One context figure | 2026-09-27 |
| Peterson-KFF 2026 Marketplace premium brief13 | One context figure (individual market) | 2026-09-27 |
| IQVIA U.S. Medicine Use Trends 202616 | One context figure | 2026-09-27 |
| 45 CFR 154.200 and 154.10311, 12 | Rate review rules | 2026-09-27 |
Backtest design. The backtests are rolling and retrospective, and they are out of sample. Each rule only gets fit on data from before the year that it predicts. The metrics are RMSE and MAE, both in percentage points. Section 5A gives the CMS panel field rules, drop rules and weights. The EWMA starts from the first observed value. Since we picked the rule set and α = 0.5 after we had already seen the same data, these results are not a prospective test. We don't report confidence intervals yet, except for the significance test in Section 5.
11 Limitations
- The national series is reconstructed. Its interior years are estimated, and the values before 2000 are even more so. Until we rebuild the series on MEPS-IC, Table 4 and Figures 2 and 3 should be treated as indicative only.
- The national results aren't significant. On 18 test points, EWMA doesn't beat naive last year by a significant margin.
- The five year window has not been tested as an optimum, and the direct test on CMS and MEPS-IC is not complete yet.
- For the CMS outcome, what we mostly have is the submitted rate, not the approved one. After 2019 the approved rates are missing from the public files.
- It's retrospective only. No forecast has been frozen in advance and scored against finals.
- Large group isn't modeled. There's no public filing panel.
- Estimates. Both the five year glide and the near term 7 to 8% are Benefitra estimates, and the Taft-Hartley path after 2027 is a Benefitra modeling assumption.
- Not reverified in this edition. The BLS and CBO pages block automated access, so the figures that rest on them were not rechecked. The yearly Hepatitis C figures also still need to be pulled again from Gilead's filings.
- The state detail covers small group only. Do not apply it to larger groups.
12 Data, citation and corrections
Download the data
| File | Contents |
|---|---|
| table4-national-backtest.csv | Table 4, national rule scores (reconstructed series, indicative only) |
| table4a-state-grain.csv | Table 5, CMS state grain scores |
| table4b-issuer-grain.csv | Table 6, CMS issuer grain scores |
| state-small-group-renewal-averages-2021-2026.csv | Table 7, state averages |
If you want the Figure 3 lookback series, the national series and the backtest code, you can ask us for them.
In the web edition, your browser builds each CSV from the matching table and adds a source line.
License. © 2026 Benefitra. Text and Benefitra derived tables are licensed under CC BY 4.0 (https://creativecommons.org/licenses/by/4.0/). You may share and adapt with credit to Benefitra and a link to this page. Third party data (CMS, AHRQ, KFF, vendor figures) remains under its owners' terms. The Funding Simulator software is proprietary and not licensed for reuse.
How to cite
Newland, S. (2026). Employer Health Insurance Renewal Prediction With the Benefitra Renewal Index (White Paper No. 01, v1.0.2 preview). Benefitra. https://benefitra.com/renewal-index/.
Version policy
The Index has a version number. In v1.0, the near term uses EWMA α = 0.5 on state small group filed changes. Five year paths use the six year state average, and carrier gaps use the 25/75 blend. If we ever change the method, the change will come with a written reason and backtest evidence. There will also be a notice on this page and an entry in the changelog.
Changelog and errata
Preview v1.0.2 (2026-09-29 ET). On 2026-09-29 the NY rule was corrected to 101+ FTEs. No numbers changed.
Preview v1.0.1 (2026-09-29 ET). Placeholders were resolved per Sam on 2026-09-29. We named the AI tools and the fact checker (Sam Newland, CFP®), and we set the license (CC BY 4.0 for text and Benefitra derived tables). We also confirmed the contact for corrections. No numbers were changed.
Preview v1.0 (2026-09-27 ET). The corrections from the internal quality review are below.
EWMA weighting is now described as equal weight (α = 0.5). Earlier text said "0.6 × last + 0.4 × prior" and also "40/60". Both of those were wrong.
"Mean of last 6 years 2.40 / 2.01" was really the mean of the last 5. The true mean of 6 values is 2.54 / 2.12.
We retracted two claims. One was that the five year test confirms the six year window, and the other that six years beats the two and three year windows across regime shifts. The two year window in fact scored 4.33 against 4.46 for six years. We also fixed "error falls monotonically to L≈15", because error first rises from one to four years.
Requested rates. We took out the claim that they carry information about later years. They add nothing to predicting next year.
We relabeled the national series as reconstructed with estimated interior years, and we also added a KFF spot check and weakened the claims that rest on it. Figure 2 got a new title because it is KFF all firms family premium, not small group.
We corrected "26 year out of sample backtest" to "18 year rolling out of sample backtest on a 26 year series", and "20 point training sample" to 8 to 25 points.
We now say that naive last year ties the EWMA on MAE, and that the difference is not significant.
All issuer grain rules are shown now, including the carrier long run mean that beats the carrier's own EWMA.
The specialty drug pipeline is restated as an untested hypothesis. The "predictive strength" chart is gone.
We took out nonpublic Taft-Hartley trust details and internal ticket text. We also relabeled the Taft-Hartley figures as a Benefitra modeling assumption, with 18% as the confirmed 2027 plan renewal.
The results in Section 9 are withdrawn while a rerun is pending. State averages now use the 2021 to 2026 vintage.
We cut vendor figures down to single cited context figures and took out the large group model built on vendor data.
We removed unverified figures (the review threshold before 2017, Hepatitis C yearly revenue, several survey components). Stale Altarum and CMS figures were replaced with current, checked ones.
We renumbered the references (the earlier list had two entries numbered 11, no 23, and in text citations 27 to 33 off by one) and the figures too.
We added disclosures, an AI use statement, the byline with CFP®, the version, methods, limitations, downloads and this changelog. We also removed the stale PDF link.
Spotted an error? Email info@benefitra.com or contact Benefitra. We log every correction here, with the date, what changed and which numbers moved.
13 References
Public sources
- PwC Health Research Institute, "Medical cost trend 2027: Behind the Numbers" (June 2026). pwc.com
- KFF, 2025 Employer Health Benefits Survey. kff.org
- KFF, 2024 Employer Health Benefits Survey. kff.org
- US Bureau of Labor Statistics, Consumer Price Index. bls.gov/cpi
- CMS Office of the Actuary, National Health Expenditure Projections 2025 to 2034, forecast summary. cms.gov (PDF), projections page
- Congressional Budget Office, Budget and Economic Outlook, and Long-Term Budget Outlook. cbo.gov
- Society of Actuaries, Getzen Model of Long-Run Medical Cost Trends, 2025 update. soa.org
- Altarum, August 2026 Health Sector Economic Indicators briefs (August 21, 2026). altarum.org
- CMS, Rate Review data (Single Risk Pool PUFs). cms.gov
- CMS, RateReview.HealthCare.gov. ratereview.healthcare.gov
- 45 CFR 154.200, Rate increases subject to review. law.cornell.edu
- 45 CFR 154.103, Applicability. law.cornell.edu
- Peterson-KFF Health System Tracker, "How much and why ACA Marketplace premiums are going up in 2026". healthsystemtracker.org
- Georgetown University Center on Health Insurance Reforms, rate filing analyses. chir.georgetown.edu
- Segal, Health Plan Cost Trend Survey. segalco.com
- IQVIA Institute, U.S. Medicine Use Trends 2026. iqvia.com
- US Food and Drug Administration, Novel Drug Approvals. fda.gov
- AHRQ, Medical Expenditure Panel Survey (MEPS-IC, planned replacement series). meps.ahrq.gov
- Gilead Sciences, Form 10-K filings 2014 to 2019 (to be pulled again from SEC EDGAR).
Benefitra research (this program)
- Benefitra Research, "Small group carrier lookback backtest and large group limits", 2026-09-18.
- Benefitra Research, "Does the requested rate help predict future small group rates?", 2026-09-18.
- Benefitra Research, "National renewal backtest and five year lookback extension", 2026-09.
- Benefitra Research, "State small group renewal averages, 2021 to 2026", 2026-09-18. Data is the Table 7 CSV on this page.
- Benefitra Research, "Modeled Taft-Hartley renewal assumption", 2026-09-18, updated 2026-09-27.
Questions employers ask about renewal prediction
Can a small employer see next year's renewal before the carrier sends it?
For small groups, the filing is the place to look. Insurance carriers file their small group rates for the next year with the state months in advance. Those filings are available in the CMS rate review files and also on RateReview.HealthCare.gov. Remember, though, that a block average change is not exactly what any one group will see. Large group works differently. Those renewals are experience rated and have no public filing, so they are driven by the group's own claims.
What is the Benefitra Renewal Index?
It is an open rule for estimating a small group renewal when you don't have a live filing in hand. For the near term, it applies an equal weight EWMA (α = 0.5) to the state's filed rate changes. For the five year paths it relies on the six year state average, and in cases where a carrier filing is missing it follows the state path instead. It is not a quote, and it is not an industry standard either.
How much could a state average renewal add to a monthly premium?
Imagine a hypothetical 20 person landscaping company in Massachusetts that pays $12,000 a month in health insurance premium. For Massachusetts, the near term Index estimate (the state EWMA) is 8.81%. So the math works out to $12,000 × 0.0881 = $1,057 more each month, or about $12,686 a year. Keep in mind this is just an illustration and not a quote. Your real number is set by your filed rate, your carrier and your health plan, so check the filing first.
Why not use my carrier's own rate history?
Across 3,964 issuer test observations in the CMS small group panel, the rules that borrowed the smoothed path of the state did better than every rule built on a carrier's own history. Why? From one year to the next, carrier series barely persist. This is why the state average makes the better default whenever there's no filing. But a filing beats both of them.